The study analyses bike data from 2019 to 2022, employing statistical modelling to isolate the effect of these relatively modest infrastructure changes amidst fluctuating cycling patterns caused by lockdowns and shifts in commuting habits.
Here's a breakdown of the key elements of their methodology:
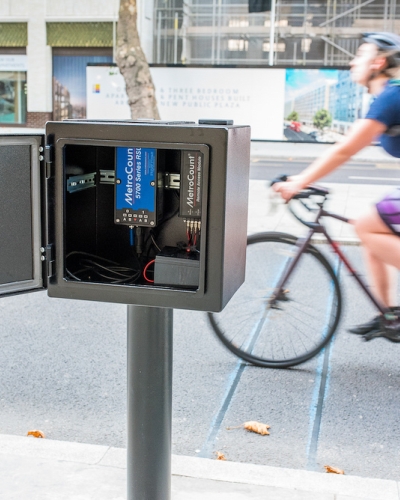
Data Source
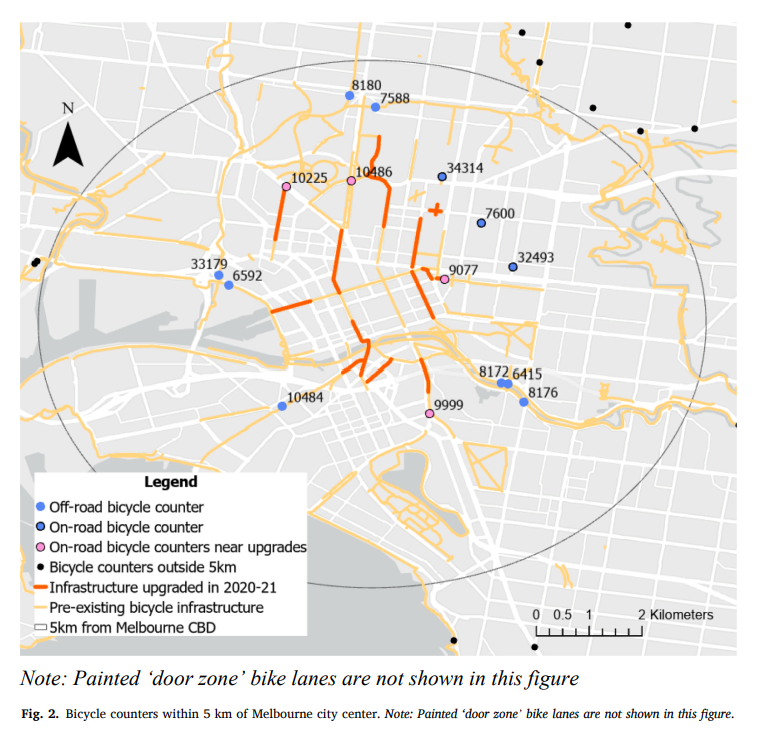
The study utilised daily bicycle counts collected from 15 permanent counters operated by the Victorian state government . These counters were located within 5 km of Melbourne's city centre (defined as Flinders Street Railway Station), representing bicycle demand in inner Melbourne. Data from the 2019 to 2022 calendar years were included in the analysis, totalling 20,629 valid data points.
Bicycle Infrastructure Classification
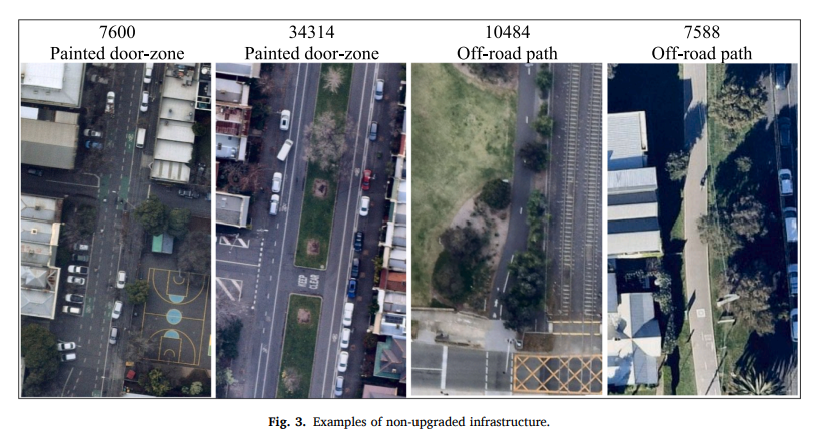
The bicycle infrastructure at each counter location was categorised into four types:
Painted ‘door-zone’ lane: On-road lane between parked cars and traffic.
Painted buffer lane: On-road lane with a painted buffer from traffic and/or parking.
Curbside protected lane: On-road lane between the footpath and parking/traffic, protected by a raised kerb.
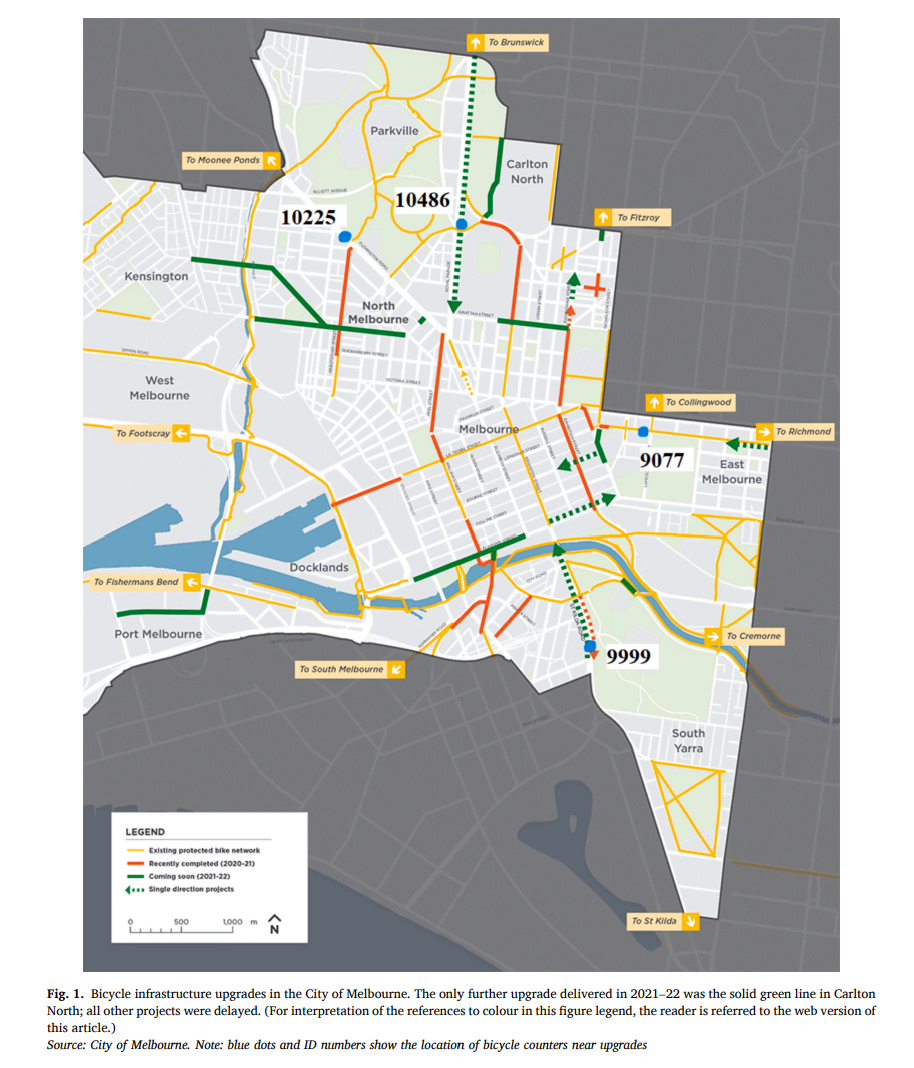
Off-road bike path: Shared path with pedestrians. Notably, only four of the 15 counters were adjacent to infrastructure that was upgraded from painted lanes to permanent curbside protected lanes during the study period (2020-2021).
Statistical Analysis: The researchers used a generalised linear mixed modelling (GLMM) approach with a random intercept for each counter location to account for repeated observations at the same sites. This technique was chosen to produce unbiased estimates of daily cycling counts while considering various influencing factors. They compared different count distributions and found that a negative binomial distribution provided a better fit for their overdispersed data than a Poisson distribution.
Controlled Factors
To isolate the impact of infrastructure upgrades, the model controlled for several various factors:
COVID lockdown stage: Pre-COVID, Lockdown, Post-lockdown 2020/21, and Post-lockdown 2022
Day of the week: Weekend versus weekday.
Month of the year: To account for seasonality.
Bicycle infrastructure category: On-road bike lanes versus off-road bike paths.
Interaction Effects
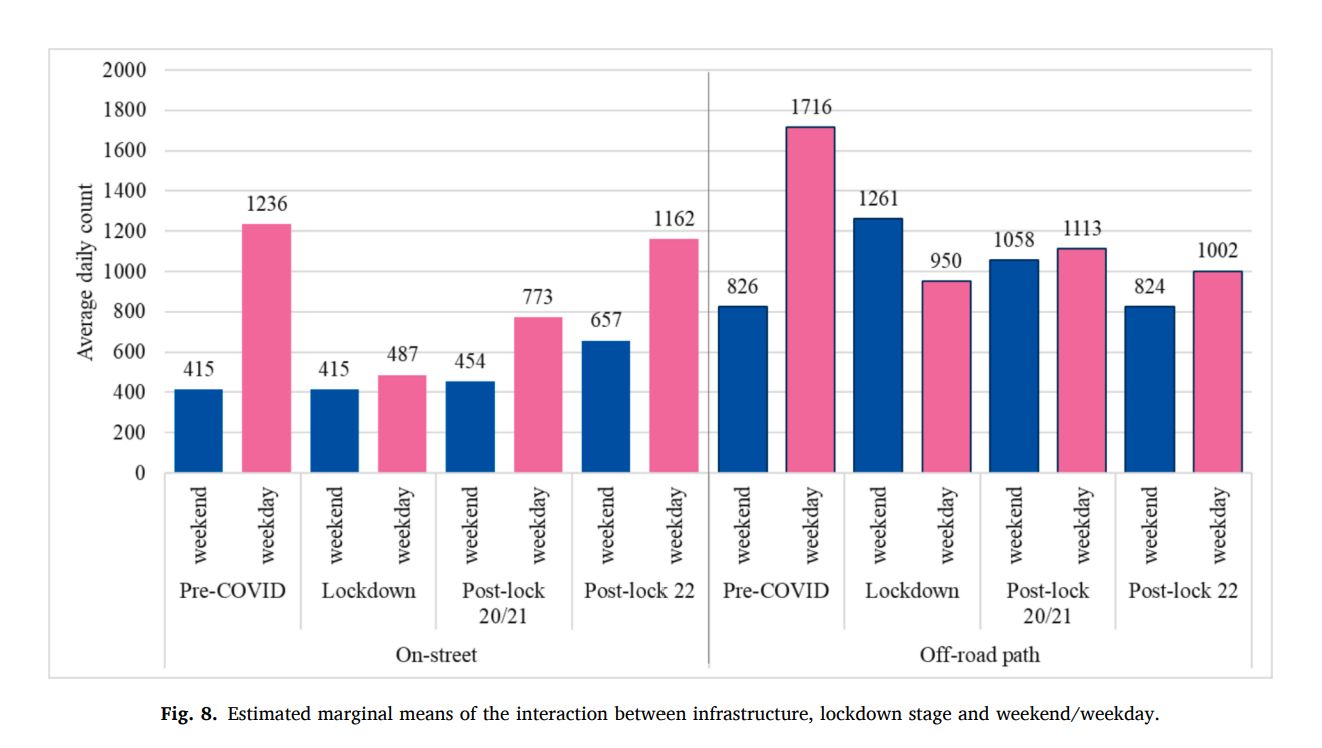
The methodology also explored two-way and three-way interactions between these factors, particularly focusing on how COVID-19 stages interacted with weekends and weekdays and the bicycle infrastructure category. The final model included a significant three-way interaction between the COVID stage, on-road/off-road counter location, and weekend and weekday, demonstrating the complex interplay of these factors.
The GLMM allowed the researchers to estimate the incident rate ratio (IRR), which compares the rate of cyclists in different settings. Model fit was assessed using AIC and BIC values, and model assumptions were checked by inspecting residuals. The final model with the three-way interaction provided the best explanation of daily cycle counts.
Key Findings
- Weekday bicycle counts were significantly dampened during lockdown periods, likely due to increased rates of working from home and reduced commute travel.
- Weekend bicycle counts showed a different trend. At on-road sites, counts remained stable during lockdown and increased afterwards, while off-road bike paths experienced a notable 53% increase in weekend ridership during lockdowns, suggesting a rise in recreational cycling. In the post-lockdown periods, weekday ridership remained below pre-COVID levels, particularly on off-road paths, where counts were still 42% lower in 2022 compared to 2019. In contrast, weekday counts on on-road sites had nearly returned to 2019 levels by 2022.
- Weekend ridership remained strong, with on-road sites seeing counts 45% higher in 2022 than in 2019. This suggests a sustained popularity of cycling for recreation. The study found that sites near upgraded cycling infrastructure recorded 7.4% higher average daily bicycle counts (855 per day) compared to sites that were not near upgrades (796 per day). These upgrades were relatively modest, ranging from extending curb-protected lanes to replacing painted lanes with protected bike lanes.
Implications
The study highlights a fundamental shift in bicycle riding patterns in inner Melbourne following the COVID-19 pandemic. Off-road paths, traditionally commuter corridors, have seen a decline in weekday use, while on-road cycling, especially for recreation, has increased.
The finding that even modest infrastructure upgrades can have a measurable positive impact on cycling rates is significant for cities considering long-term cycling infrastructure investments. It suggests that despite the overall dampening of weekday commute trips, improvements to cycling networks can still encourage cycling.
Please refer to the research paper by Monash Institute of Transport Studies for more detailed information on the study methodology and results.
Got a great MetroCount story? Share it with us and let the world know the great work you're doing in your community.