
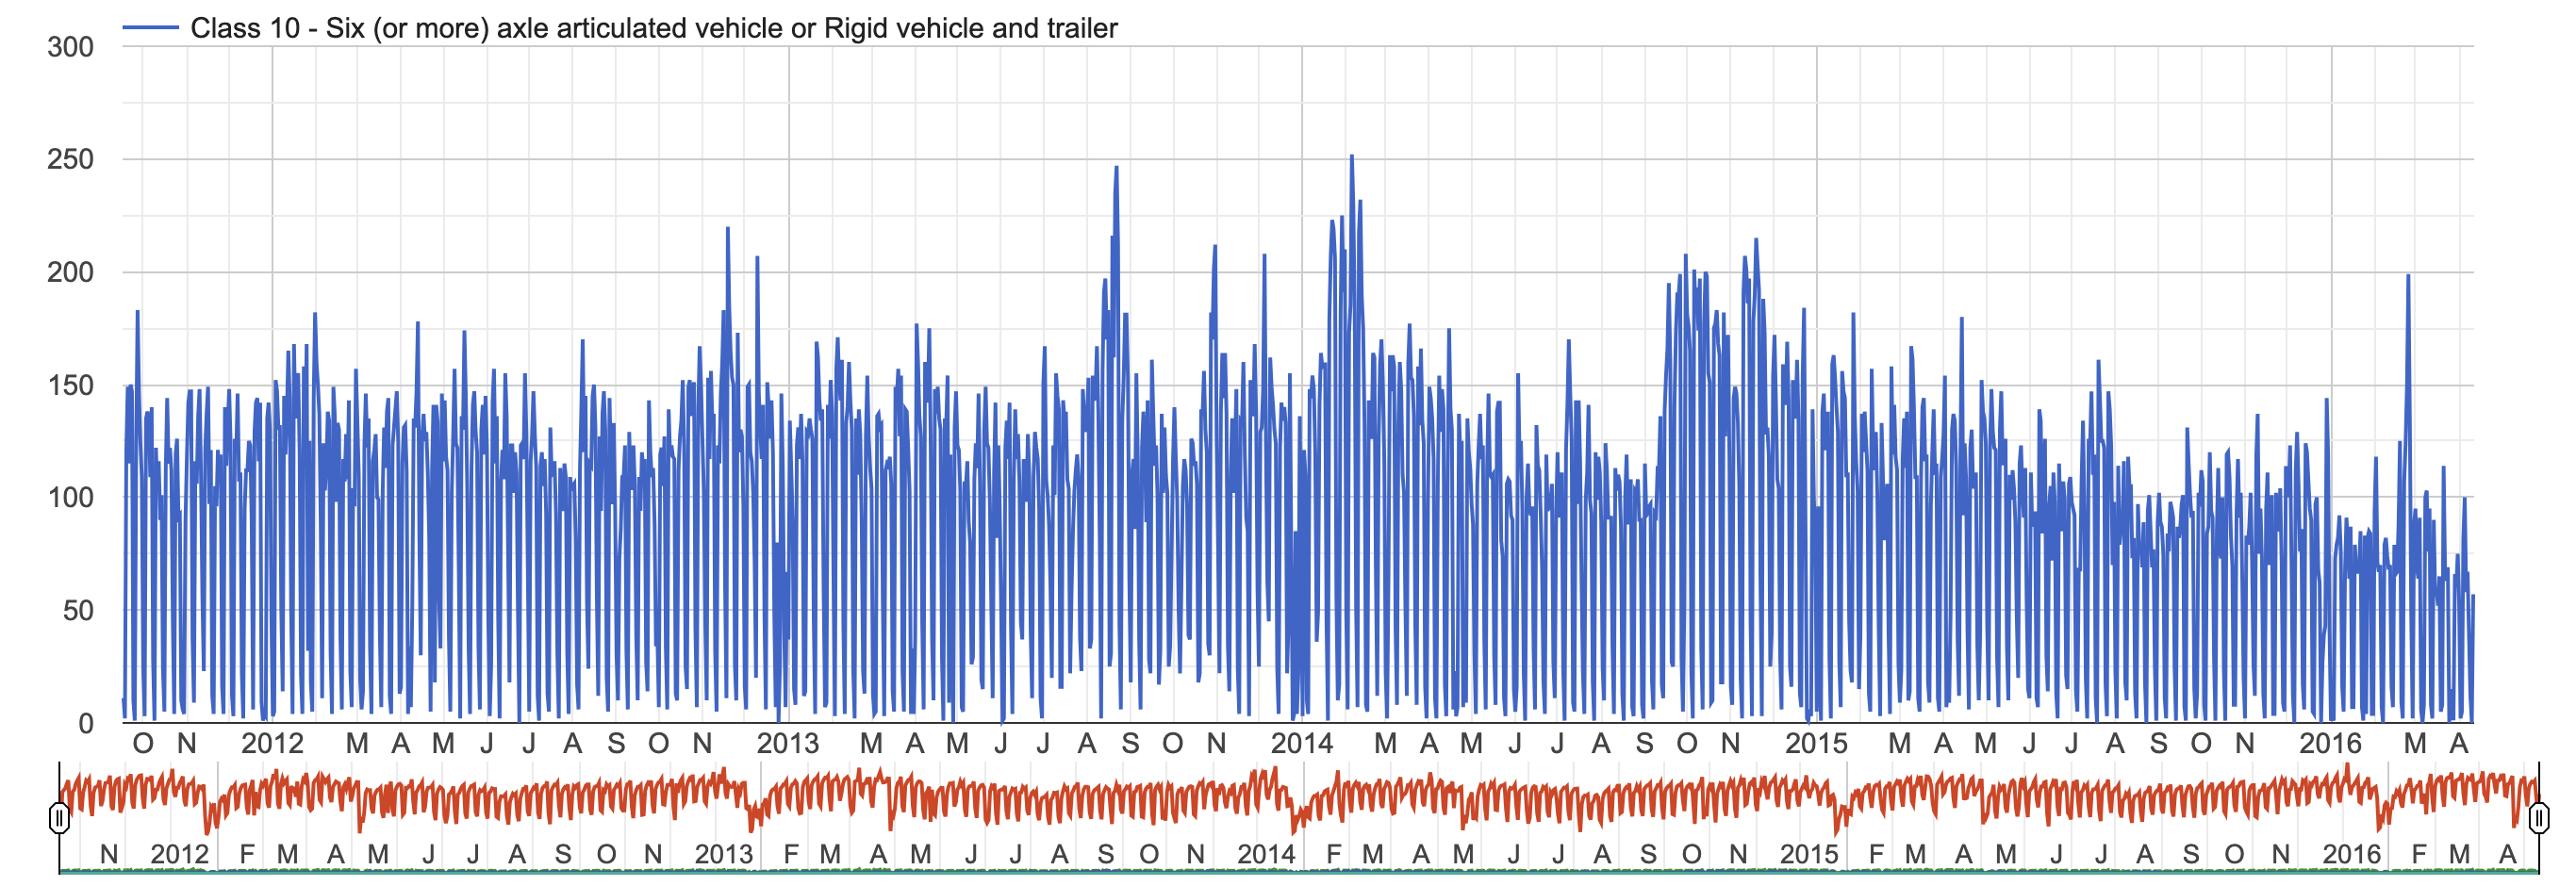
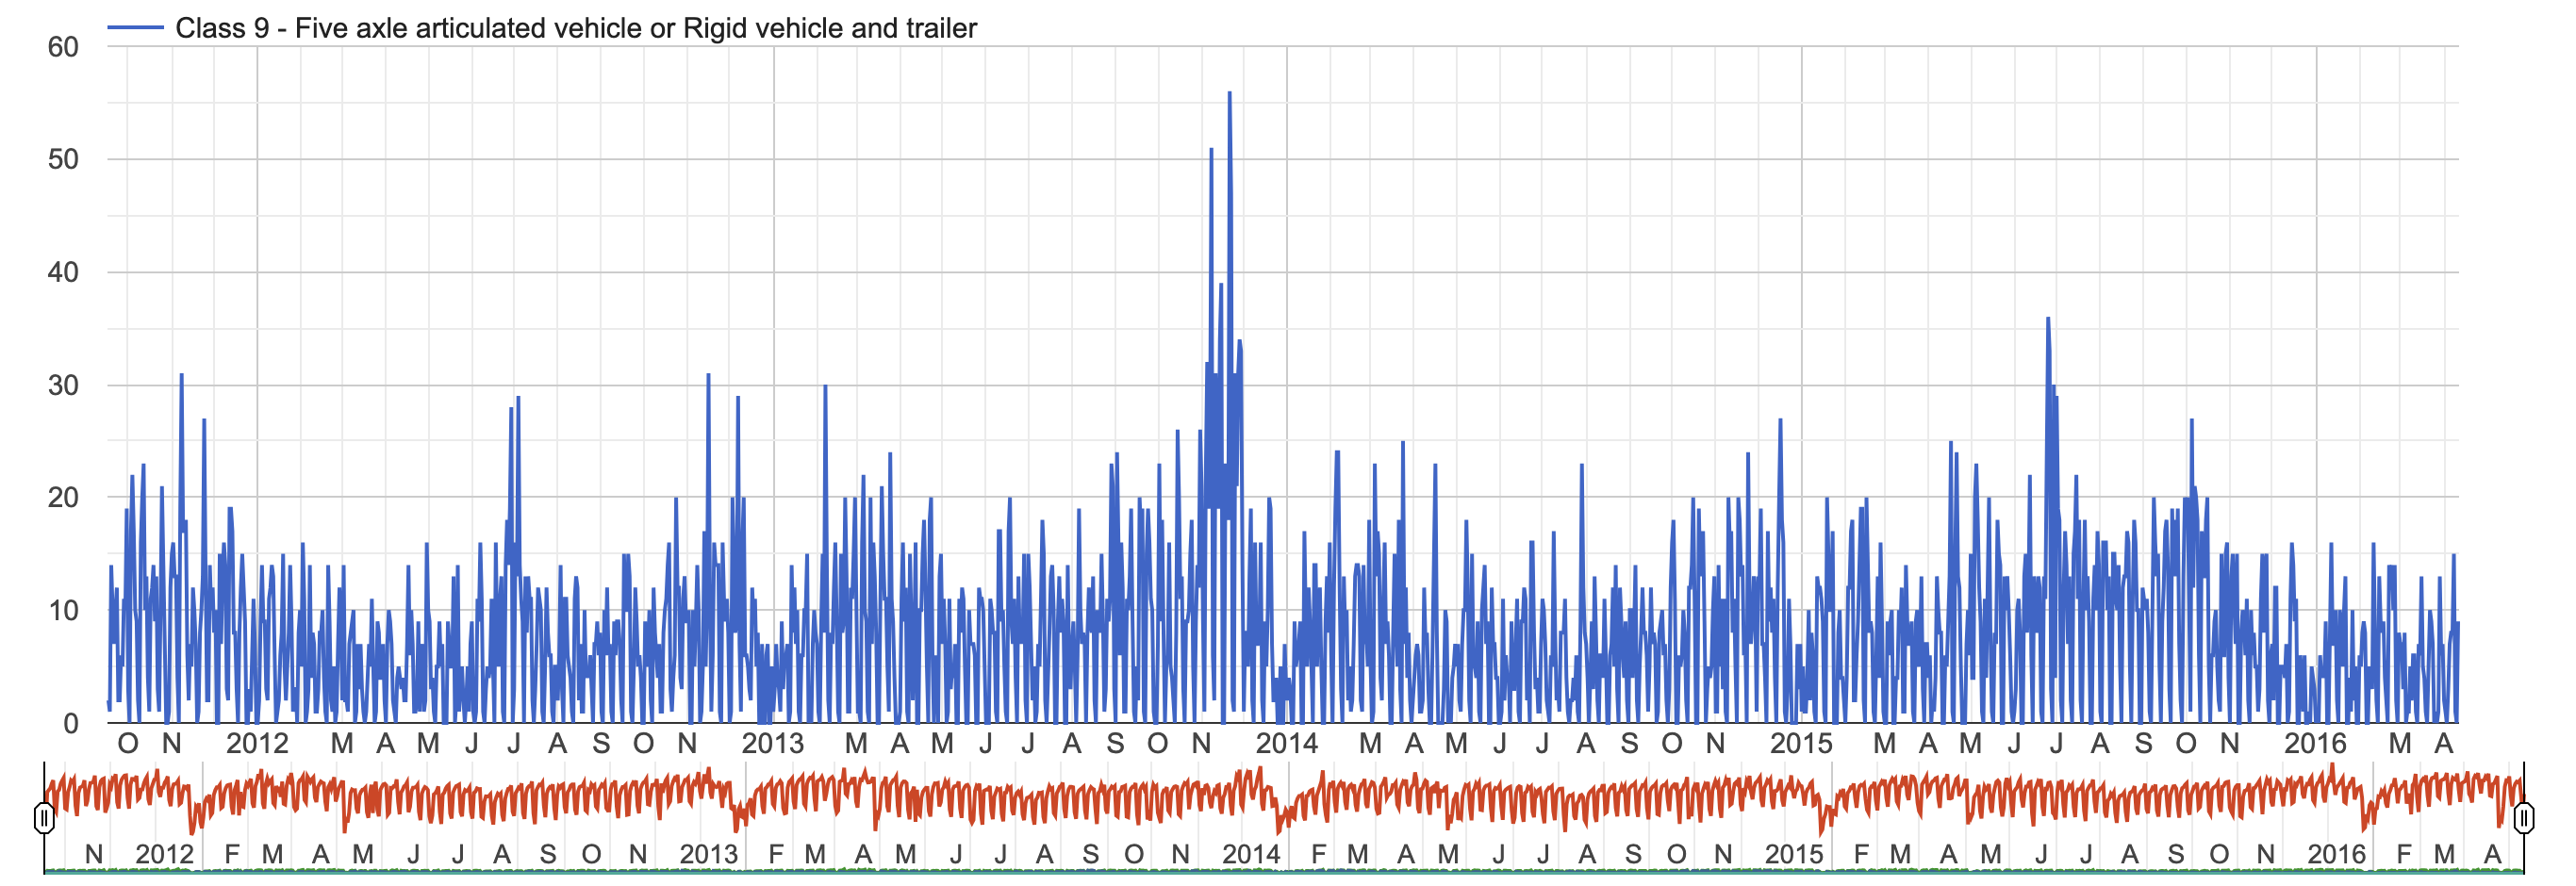
Heavy Vehicles
Being a port city, large volumes of container freight are moved through Fremantle on routes shared with commuter traffic. Vehicle classification data allows the city to justify rerouting freight traffic to optimise traffic flow. Additionally, the city authorities are monitoring these routes to ensure compliance.
To determine what types of loads heavy vehicles have been carrying on Ord Street, Dwight Kostusik recently undertook a video survey. Coupling this footage with MetroCount traffic data, has provided a detailed understanding of types and volumes of freight at the site.
Vehicle classification data allows the city to justify rerouting freight traffic to optimise traffic flow.
“The larger vehicles have been decreasing so, yes, this is a trend we have noticed. We did also see a rise in the lower heavy vehicle class. The latest configuration can carry 4 TFEU (20 ft equivalent unit containers) which works out well for logistics movements as the previous configuration could only fit 3 TFEU’s. This is a prime mover and 2 trailers. We mostly see single trailer units with the 40ft containers on Ord Street.”
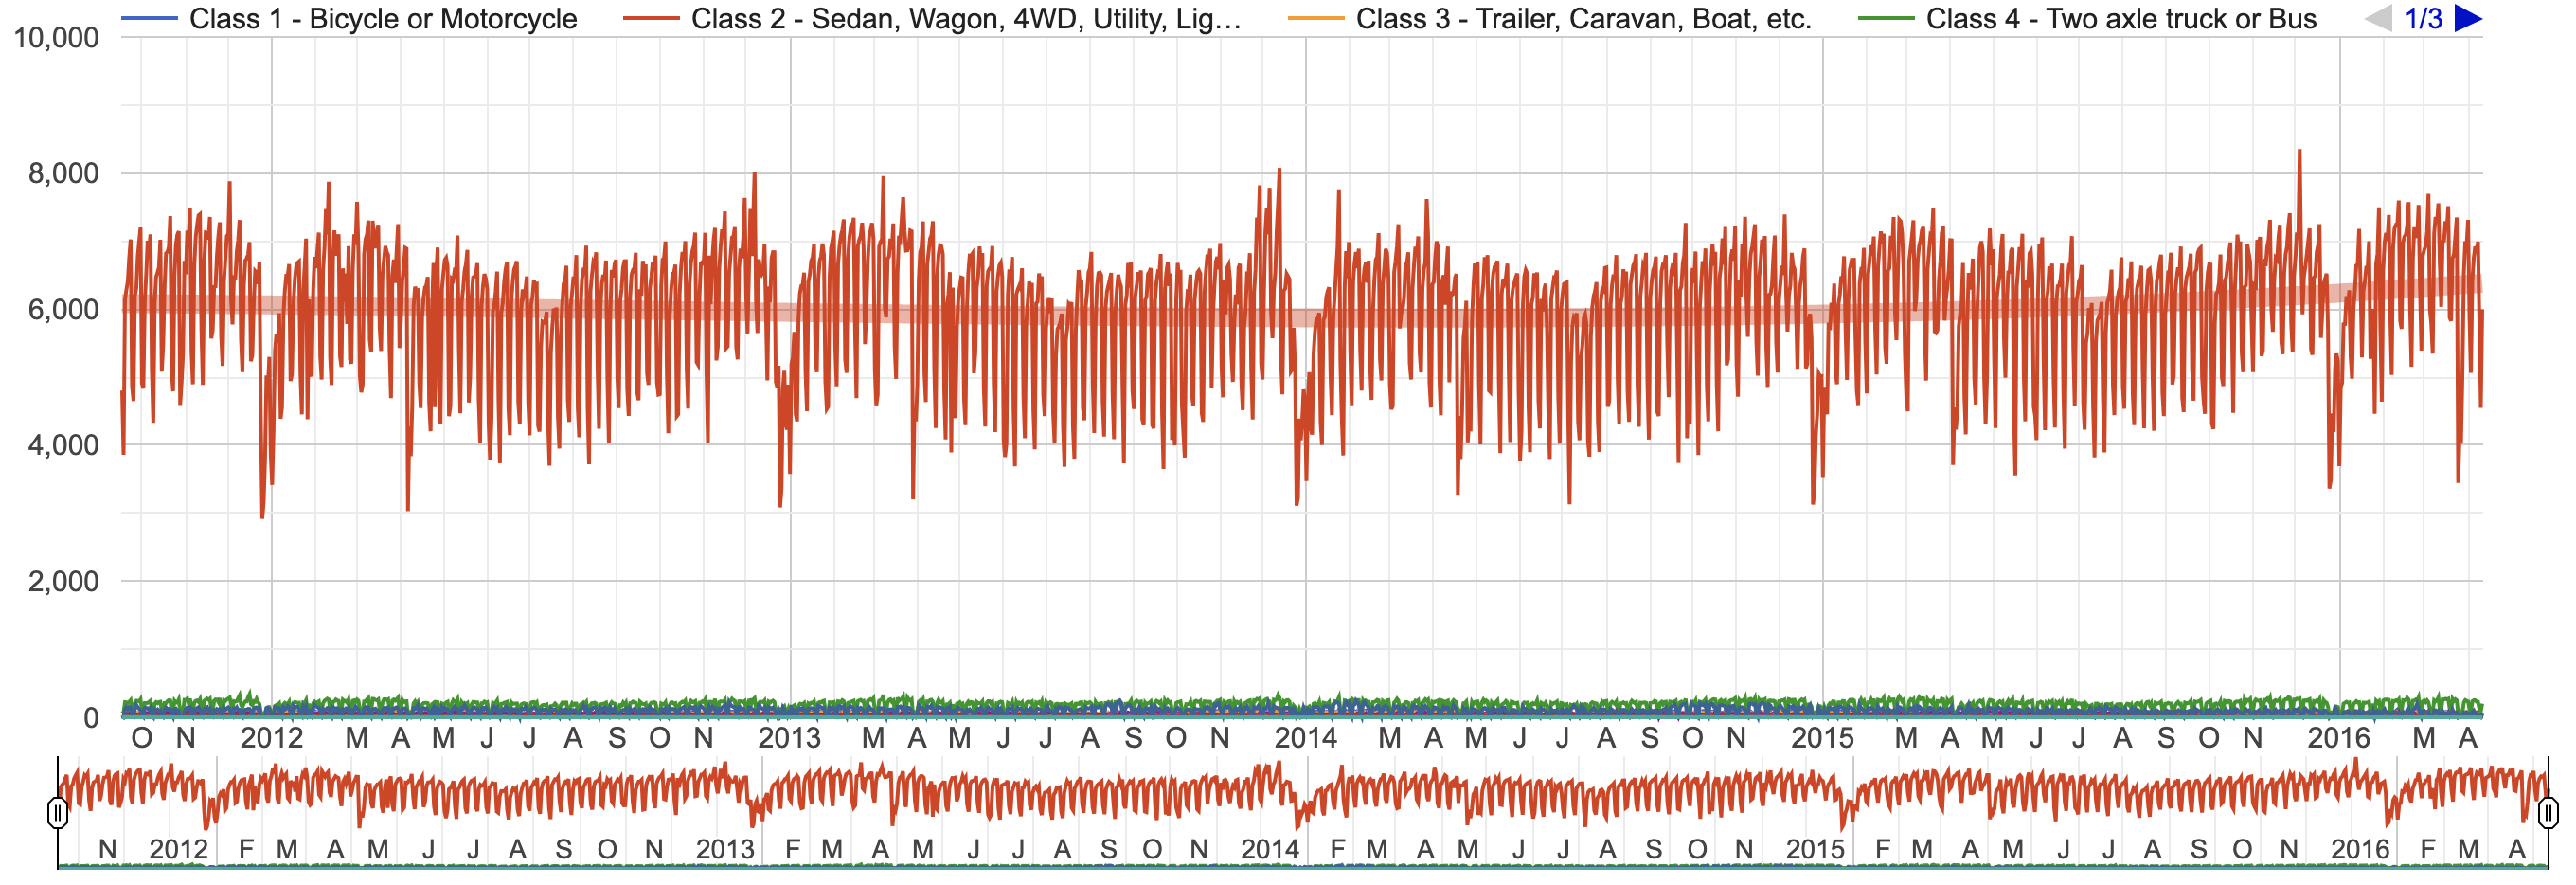
North Bound Traffic Volumes
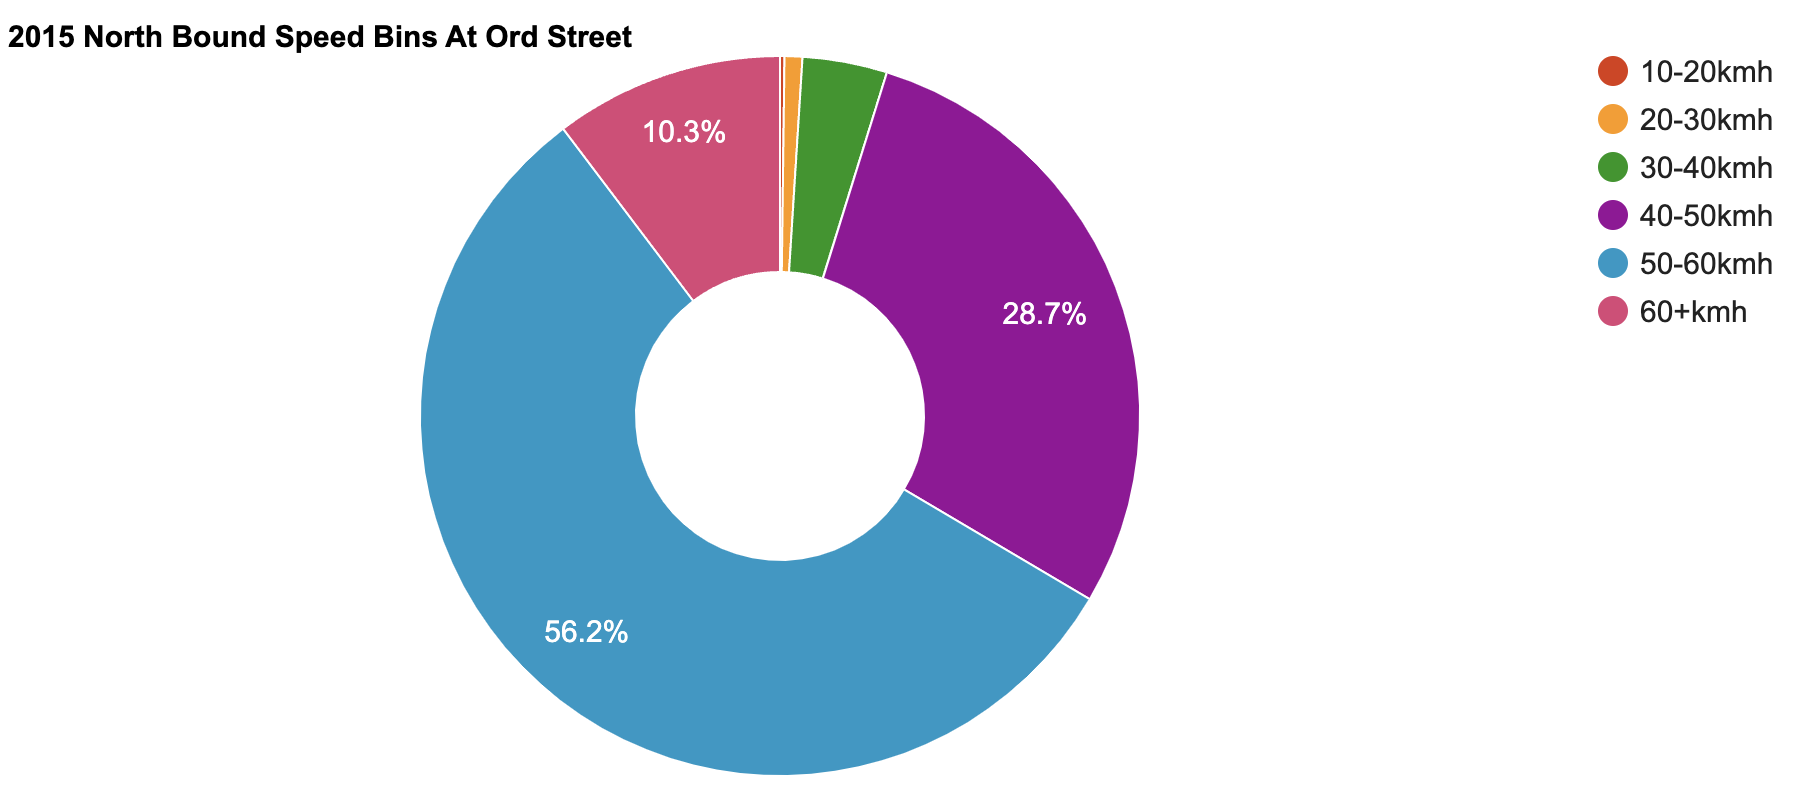
Speed Information
Located on Ord Street, this site is in immediate proximity to the Fremantle Arts Center, a popular tourist attraction. Monitoring speed allows the council to identify possible safety concerns throughout a typical day. The northbound 85th percentile speed at the site over the course of 2015 was 58.38km/h, indicating that reasonable drivers are staying within the prescribed speed limit. A virtual day analysis of data from the whole year of 2015 shows that speeds increase between 9PM and 5AM when traffic volume is low.
The north-bound 85th percentile speed at the site over the course of 2015 was 58.38km/h.
Seasonal Variation
Fremantle has a rolling traffic data collection program, collecting week-long surveys from sites around the city with portable counters. The data collected by the permanent site provides a reference for seasonal changes in traffic. Adjustment factors produced by MTE allow road managers to compare a balanced view of traffic statistics collected at different times of the year. The results show that the quietest months of the year are January and July while Saturdays and Sundays have significantly lower traffic volume than weekdays.
Monthly volume and adjustment factor
Jan – 179985 Adjust = 1.06051
Feb – 180788 Adjust = 0.92524
Mar – 192796 Adjust = 0.93435
Apr – 172498 Adjust = 1.04430
May – 185874 Adjust = 1.00376
Jun – 176855 Adjust = 1.01857
Jul – 175041 Adjust = 1.06588
Aug – 178190 Adjust = 1.04705
Sep – 173510 Adjust = 1.00113
Oct – 190484 Adjust = 0.97947
Nov – 193330 Adjust = 0.93177
Dec – 182606 Adjust = 0.99702
ADT and adjustment factor by day of the week
Mon 6464.528, Adjust = 0.99521
Tue 6949.462, Adjust = 0.92576
Wed 7170.868, Adjust = 0.89718
Thu 7123.094, Adjust = 0.90320
Fri 7222.774, Adjust = 0.89073
Sat 5421.075, Adjust = 1.18677
Sun 4945.906, Adjust = 1.30078
Got a great MetroCount story? Share it with us and let the world know the great work you're doing in your community.