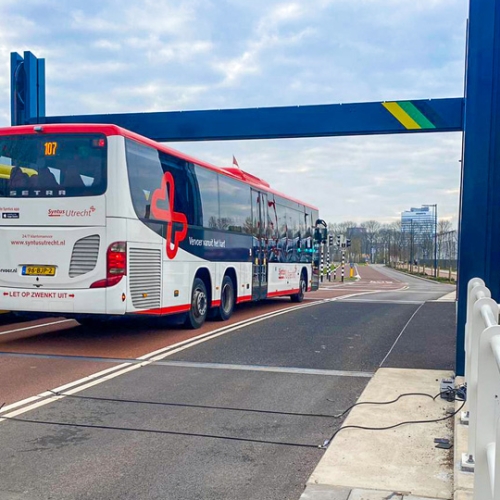
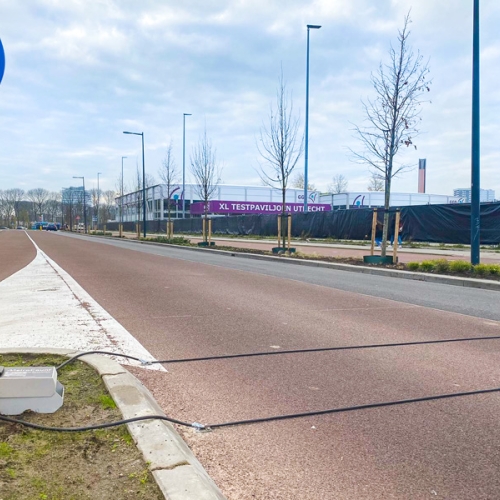
Wouter Schuijtvlot – Senior Project Manager Constructions at Gemeente Utrecht gives us more information:
“Legally, it must be demonstrated whether the existing bridge can handle this change. For this purpose, we calculate the pavement distress rate which gives us insight into the bridge’s remaining life.”
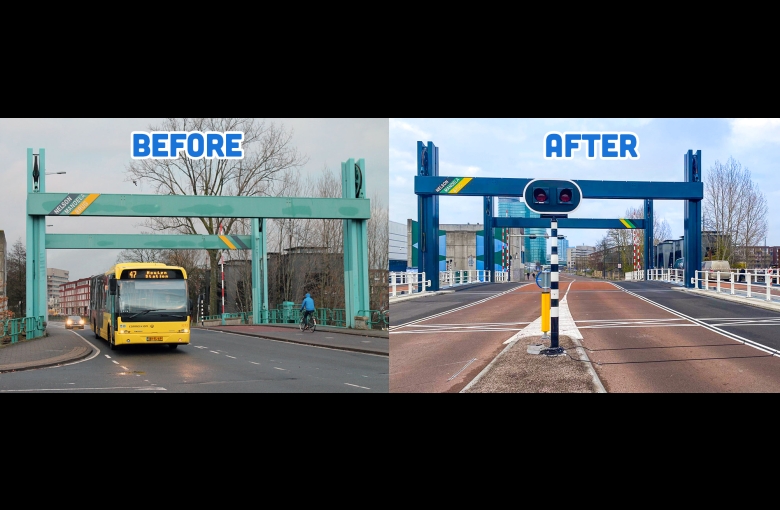
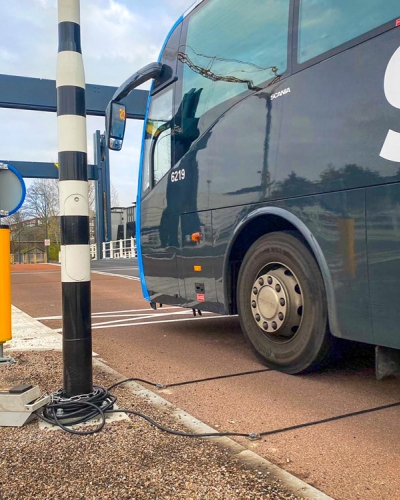
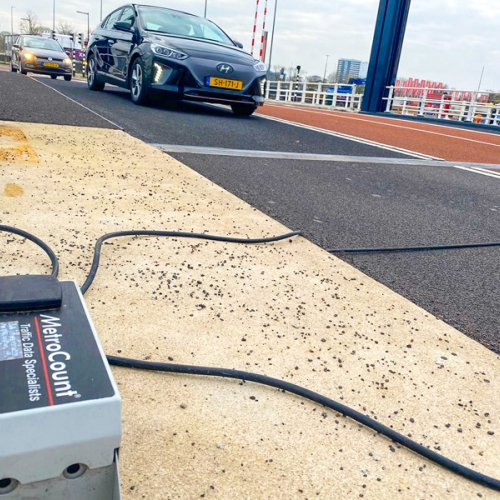
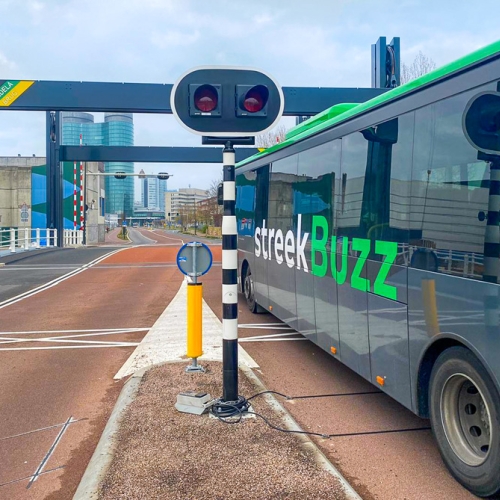
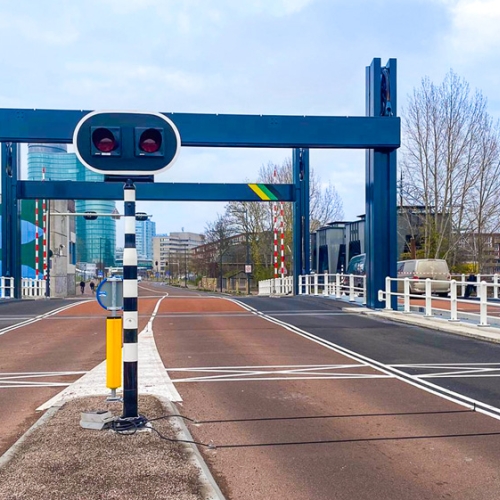
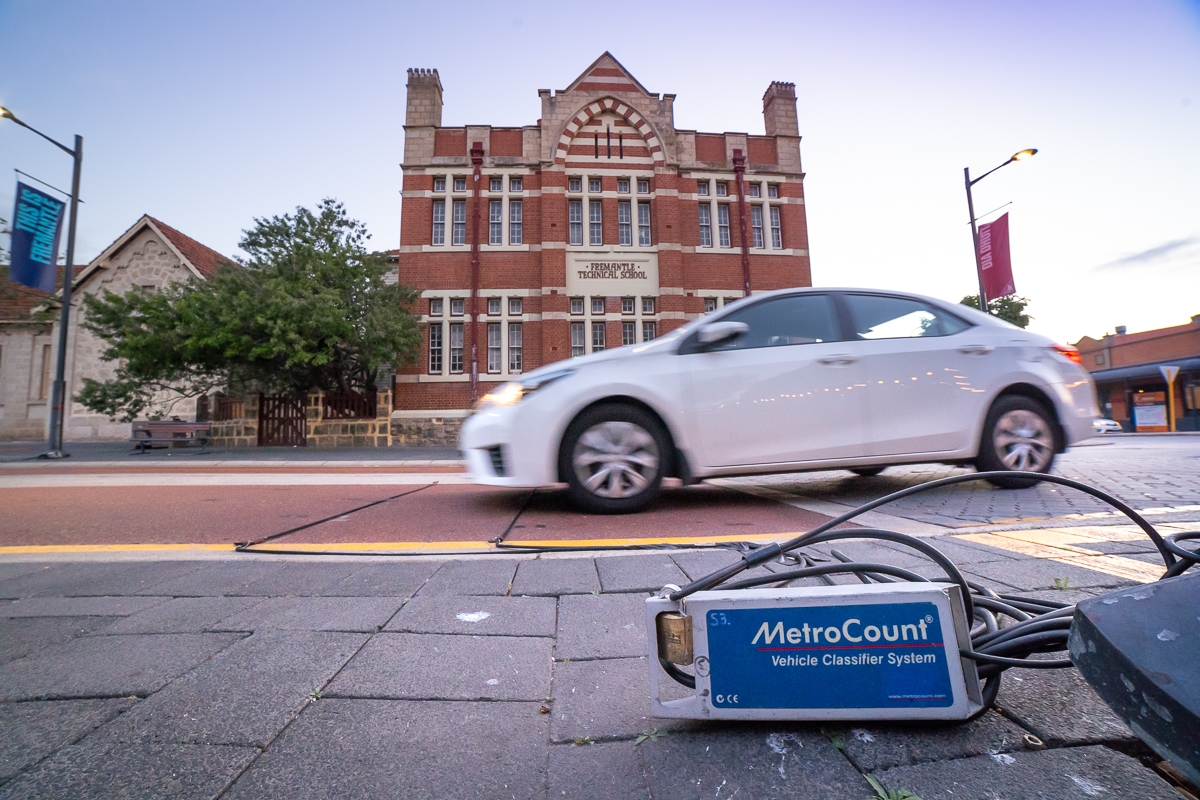
To better understand the traffic on the bridge, MetroCount bike and vehicle monitoring surveys were conducted between 18 Dec – 14 Jan. The data was used to determine the actual vehicle loads and the number of load changes. Tube counters capture the axle configurations of the vehicles, making it clear which type of vehicles have passed and with which frequency. The accuracy of these figures greatly affects the value of pavement distress rate.
“For each vehicle class, we establish a maximum axle load. Because bus traffic is by far the biggest factor in the number of load changes, the actual traffic load is calculated on the basis of the empty weight of a bus and its occupancy rate. Taking into consideration also the frequency of each vehicle class, we can then determine the rate of pavement distress.”
Since the Utrecht municipality has recently opened a new, state-of-the-art cycling bridge and has other constructions in plan, we expect more traffic studies may have to be carried out.
Got a great MetroCount story? Share it with us and let the world know the great work you're doing in your community.
