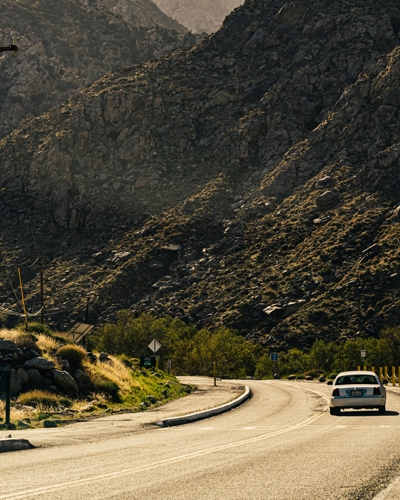
We recently chatted with Douglas Ouren, physical scientist for the United States Geological Survey, about their investigations into the ecological impact of traffic on the movements of wildlife.
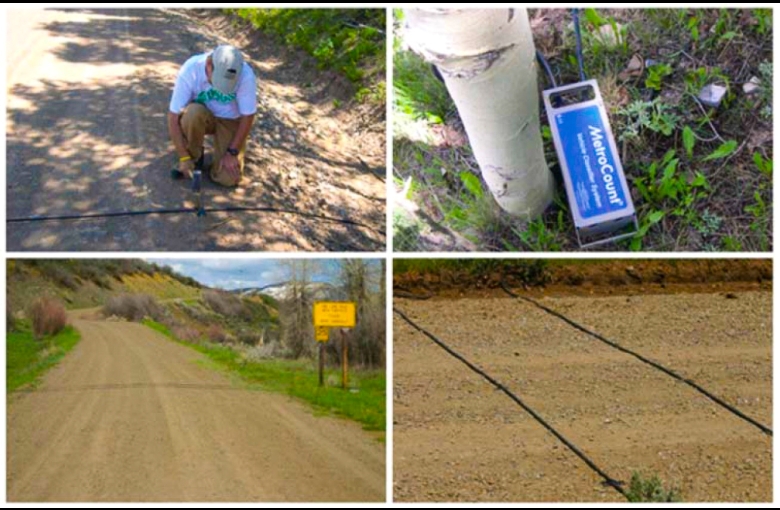
After extensive testing, Douglas found pneumatic tube traffic counters to be the most reliable and robust method for monitoring the unpaved roads in question. He and his team analyse resulting traffic data with animal movement data to inform seasonal road closures and to understand the overall environmental impact of motorised traffic in remote Colorado.
Read more in the interview below:
Can you give us a brief overview of the research you do?
“I have been a physical scientist for the USGS for the past 30 years where my main role has been to investigate the impacts of motorized traffic on habitat use and seasonal movements of various wildlife species.
Our traffic monitoring takes place on low volume, mostly unpaved roads in rural to remote settings. Most of our sites are between 1600 and 3200 meters in elevation, thus we are only able to collect data in the snow-free months from May through to October.
In general, results from our monitoring have been used to evaluate potential impacts of road use on specific species and to provide Federal and state land managers with model results to assist in their development of land management prescriptions.”
How did you evaluate which was the best method to monitor traffic?
“After extensive research, we found five tools that we thought had some potential for evaluation including:
- Magnetic sensors,
- Seismic sensors,
- Pneumatic tube sensors,
- Infrared motion sensors,
- Camera traps,
- And manual counts conducted by graduate students.
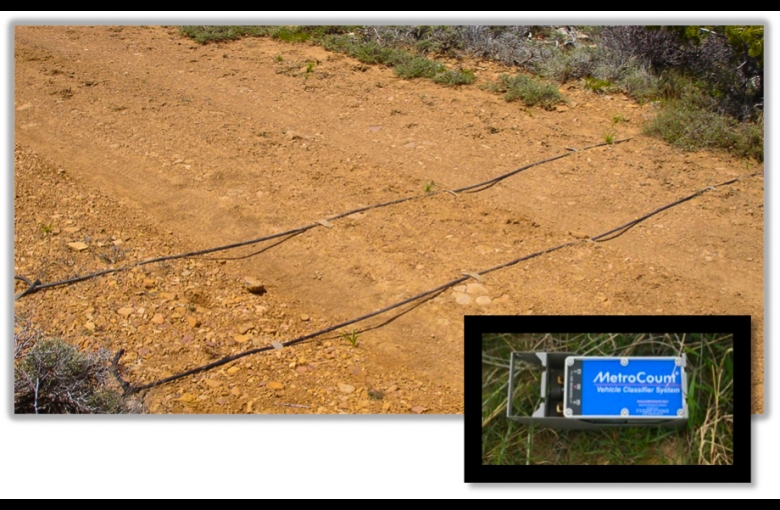
Each of the options had its advantages and disadvantages, but after testing for a couple of months, the hands-down winner was the pneumatic tube sensors. They were not the least expensive but very low maintenance and provided the most robust data sets.
In comparison, the other sensors we tested were either prohibitively expensive, did not provide data of interest, required extensive maintenance or simply were just not reliable in their counts.
Initially, we were concerned with potential vandalism since the sensor and the tubes are so visible. Our vandalism rate is well below 3%, which we feel is pretty amazing since we operate these counters in very remote areas, where some counters are left for nine months or more without being checked.
"We have had pneumatic sensors deployed on gravel roads for over 4 years in some locations and the only maintenance that has been required is to change batteries and download data about every nine months along with replacing tubing about every 2 years." Douglas Ouren
What specific elements of the traffic data you collect do you most closely analyze and why?
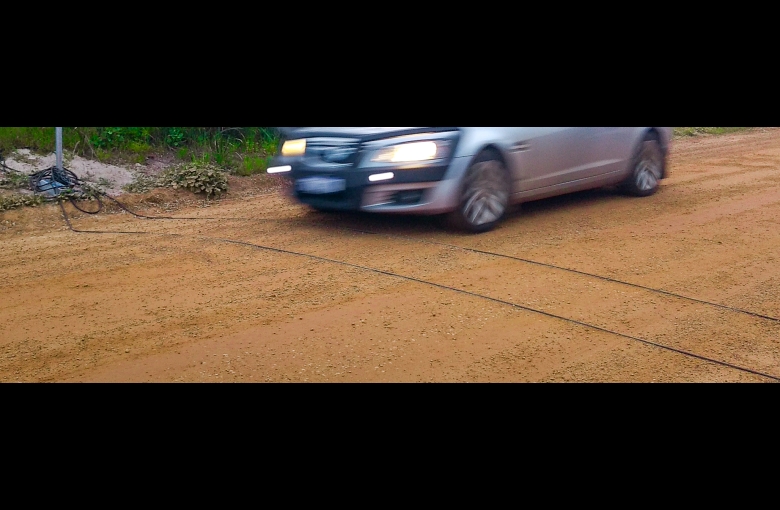
“The objective of the majority of the monitoring we do is to establish trends on motorized use during the snow-free months of the year. From an analysis standpoint, the traffic data we are the most interested in include vehicle class, volume, speed, direction, and time of day.
- Vehicle class allows us to identify the number and types of vehicles using the roads and how each of those classes represents the overall use.
- Traffic volume simply helps us determine overall use including increases and decreases for an individual road or a complete monitoring network.
- Speed data provides us with another metric from which to evaluate impacts on the species of interest.
- Recording the gap between vehicles allows us an opportunity to evaluate general traffic patterns and again evaluate the potential impacts.
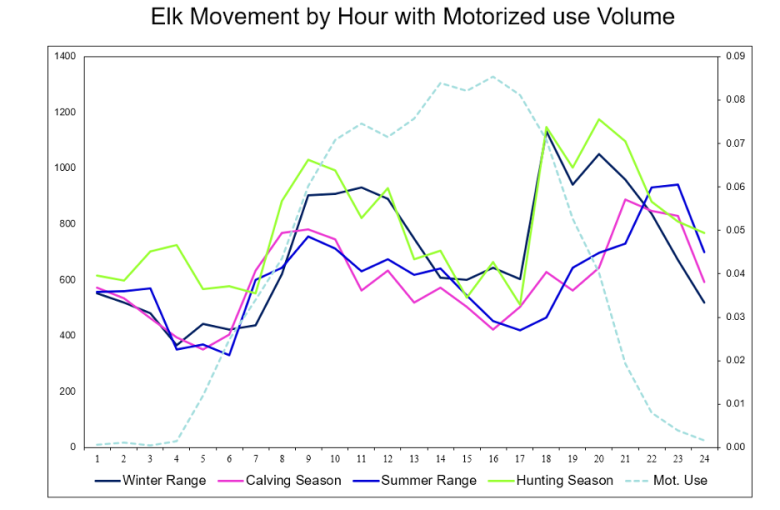
- Time of the day data paints a picture of daily use. For example, elk are considered a crepuscular (twilight) species and thus traffic during twilight hours could be more impactful on their habitat use and movements.”
Were you surprised by any of the results you have retrieved?
“I think the most surprising result has been the use of these road networks throughout the night, sometimes at relatively high speed.
"Early on in our monitoring efforts, on a whim, we decided to put a vehicle counter on a closed and gated road. Not only did we find vehicles using the road, but land managers were able to investigate this use further and tie it to illegal activities." Douglas Ouren
We have also discovered a new phenomenon that we call “vehicle spawning”. The phenomenon takes places when a single-vehicle pulling a trailer with additional vehicles (i.e. motorcycles or all-terrain vehicles) makes its way up a road network, stops and unloads the trailered vehicles.
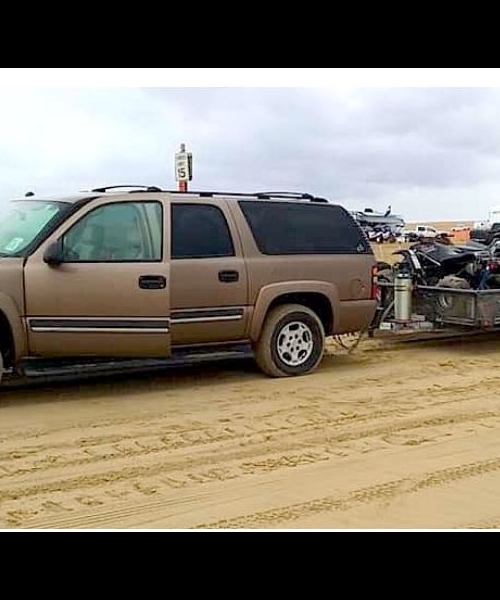
This increases the vehicle count as you progress up the network, negating the common thought that vehicle counts will decrease the further up the network you go.
Our monitoring is on low-traffic volume networks, thus, the addition of seemingly few vehicles can have a large impact on the ecology of a system by creating unauthorized routes that further fragment the landscape and displace wildlife.
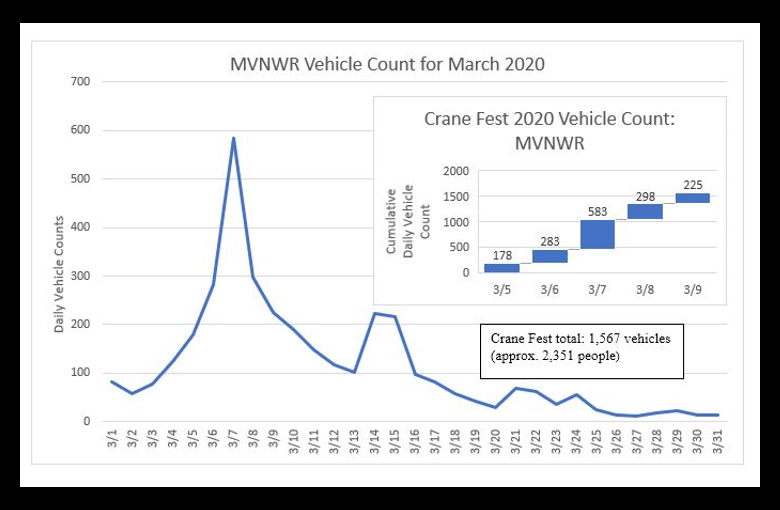
It’s also interesting to observe the effect of local events, such as last year’s Crane Fest, on usual traffic movements. The data can be used to estimate the number of participants/visitors and estimate the potential economic impact of events.”
What trends are visible from the data?
“Probably the most interesting trends we have seen are:
- The consistency of traffic peaks,
- The increased use of traffic over the years,
- And the decrease in use during economically difficult times in the United States.
We initially thought that we would see a bimodal distribution of daily traffic volume with a peak in the morning and a peak in the afternoon. However, our monitoring has shown that almost regardless of traffic volume, the peak tends to be between 3 and 4 pm. We have also seen a consistent increase of approximately 30% over a five-year period for one of our monitored networks.
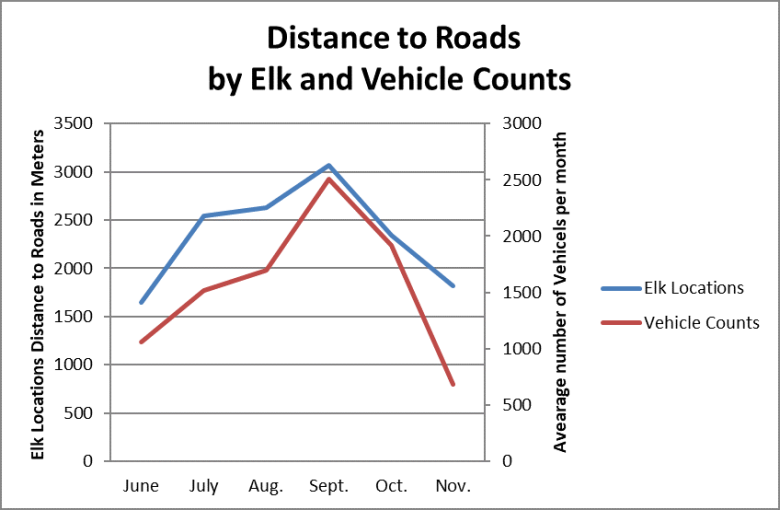
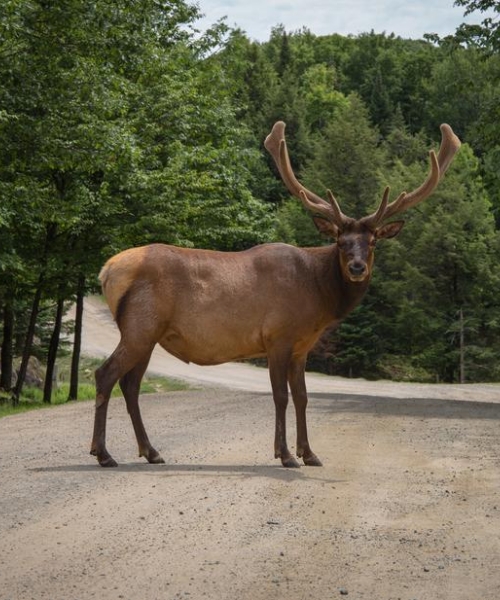
Results of our monitoring efforts, not unlike a lot of ecologically based studies, have shown a lot of variability depending on species and questions asked. For example, if the question is “what is the impact of increased traffic volume on Rocky Mountain Elk?” we have found it depends if the road is bisecting private lands or public lands.
In most cases on private lands elk show little concern with varying traffic volumes, whereas on public lands elk tend to move further away from roads with an increase in traffic volume.
On the other end of the spectrum, female Gunnison Sage Grouse spend little time within 400m of low volume roads regardless of land management designation. As vehicle volumes exceed 10 vehicles a day, we start seeing the grouse move even further away from the road.”
How has this data informed ecological conservation efforts?
“Results from these projects have been utilized in several preservation efforts. The most common reaction to the results of these projects has been a modification of seasonal road closures.
One example of this is the seasonal road closures of additional roads during the elk calving season to reduce traffic-related disturbance.
A second example of this is the closures of roads during the mating season of the Gunnison Sage Grouse, once again mitigating the impacts of traffic-related experience.
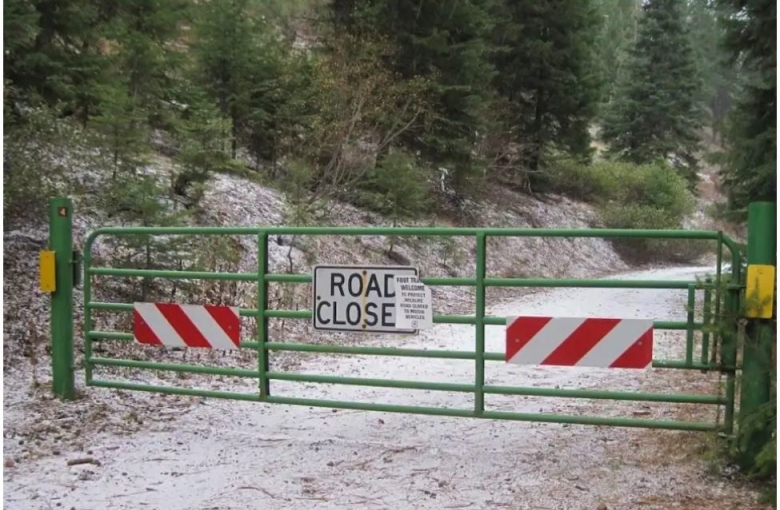
“We have also found that seasonal road closures can be a benefit when compared to permanent road closures. The permanent closures can have unintended consequences i.e. roads with minimal use can provide a deterrent to species X while providing an incentive for species Y.” Douglas Ouren
It is difficult to quantify the impacts of that use without knowing the traffic levels on the road or network of roads of interest."
Do you share any of the information you collect with other government agencies? If so, how do they benefit from it?
“We do indeed share the results of our investigations with state and federal agencies responsible for land and wildlife management across the landscape. They use the results of our investigations in a number of ways, including the development of adaptive management plans focused on the ecological sustainability, and of the habitat and wildlife species they are responsible for.
Our data has also been used to estimate the visitor use and economic impacts on the areas we have been monitoring and even though it was not our original intention, our monitoring data has also been used for law enforcement.”
In closing, we have found that the use of traffic monitoring as a resource for land managers can be very informative, relatively low cost, low maintenance and a very effective way to develop short or long term data sets. These data sets inform the creation of robust, adaptive management plans; assess visitor use and provide a wealth of knowledge to address current and future landscape management plans.”
Got a great MetroCount story? Share it with us and let the world know the great work you're doing in your community.
