
Ealing Council aims to achieve participation levels similar to those in Denmark or the Netherlands. Although there is still lots of work to be done, with an early adoption of advanced data-gathering technologies, Ealing is well placed to take advantage of available grants and funding.
Ealing has strongly focused on measuring and quantifying the impact of programs and treatments. Detailed data gathering has assisted the council in promoting and justifying improved conditions for cyclists while also maximising funding for future cycling projects.
A Range Of Bike Data Collection
With a range of both automated and manual data collection employed, statistics have helped to correlate observed trends, identify peak commuter periods and calibrate cycling plans. Some of the data types gathered include:
- Cyclist volumes at sites across the Borough
- Mode share surveys
- Reported bike theft rates
- Bike-related injury statistics
- Cycling speed and direction at nominated points
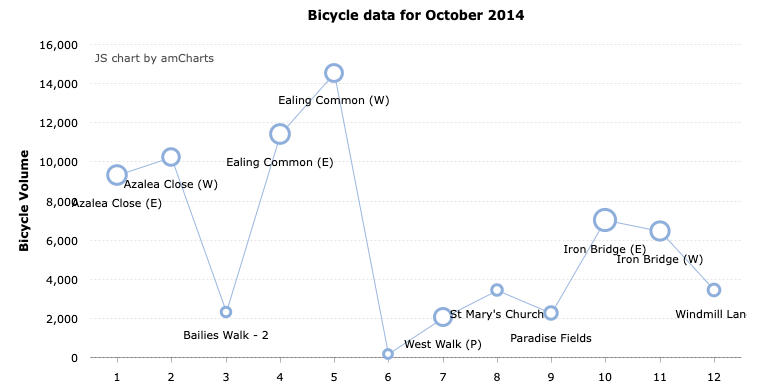
The advanced RidePod BP counters have played a key role in providing benchmark cyclist data from 11 strategically positioned monitoring sites across the network. The high accuracy achieved by the MC equipment (independently verified to 99%) provides a verifiable record of cyclists at several sites across the Borough.


Cycle Monitoring Sites in Ealing
Sites in Ealing vary greatly from low-volume off-road sites to high-volume bike lane sites on popular commuting routes. Data from these sites is retrieved remotely, along with regular site diagnostics, and alerts in case issues occur. Additionally, the solar panel located on top of the cabinet enables sites to keep their batteries charged, avoiding the need for mains power.
Ealing Council has been operating cycle counters since 2010. In the past year, six additional sites have helped to characterise an even greater number of locations. The data has highlighted a yearly growth in the volume of cyclists of up to 28% (as stated in the Cycling in Ealing 2014/2015 report).
MetroCount Cyclist Statistics
Ealing Council takes advantage of the extended analysis available from the MetroCount system to capture detailed information beyond simple volumes. Volumes can be assessed in relation to the time of day, week, month or year as well as being filtered by speed and direction of travel. This extended data analysis allows planners to gain further insight into the typical use at cycle sites during different times of the day, allowing them to proactively identify potential issues with cyclist/pedestrian interaction and congestion on paths.
Next Steps in Ealing
A large goal of any active transport plan is to reduce the number of cars on the roads. Ealing will be combining road traffic information with adjacent cycle data to observe changes in vehicle flow, relative to the cyclist numbers. Decreased vehicle usage as a result of mode shift will result in an increased vehicle flow and reduced congestion. Monitoring changing vehicle volume and flow over time provides strong justification for the continued expansion of active transport programs.
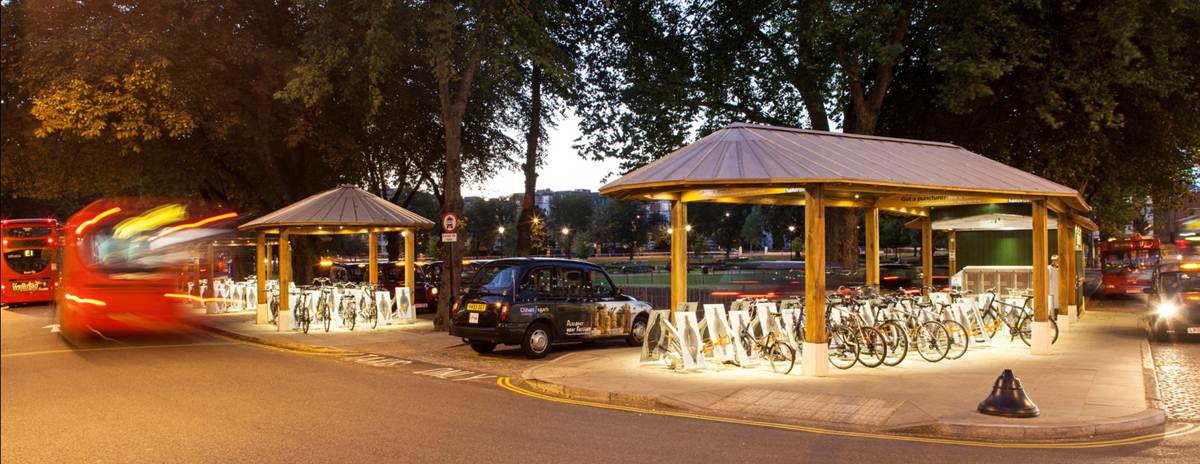
Following the success of the cycle hubs at Ealing Broadway (2012) and North Acton Cycle (2014), the Council is looking to open another 4 secured parking spaces in the next two years. Along with them, the modernisation of 5 bike lanes and the development of another 6 routes. It’s no surprise that Ealing’s dedication to improving cycling infrastructure has recently received international distinctions.
Got a great MetroCount story? Share it with us and let the world know the great work you're doing in your community.


