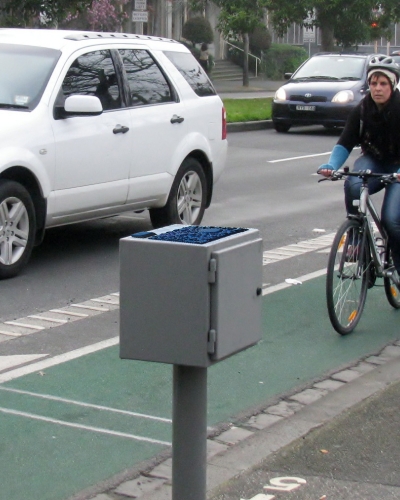
Evaluation is a necessary part of any trial. Local and state governments need to ensure they are making good investments on facilities that are fit-for-purpose, and meet the needs of the community.
In the case of bike lanes, a common evaluation is counting the number of bikes before and after installing the lane. If we count more bikes after the lane is installed, we may be tempted by the sweet smell of success. Makes sense, doesn’t it?
Well, there is a bit more to it. To determine whether pop-up bike lanes really are cutting the mustard, we need a carefully detailed monitoring and evaluation plan spanning at least 12 months.
This may seem a bit demanding, but it is necessary to ensure that seasonal changes in bike riding habits and external factors, such as lockdown restrictions, do not affect the trial findings.
Here are five ways in which we can evaluate a bike lane in a fair manner.
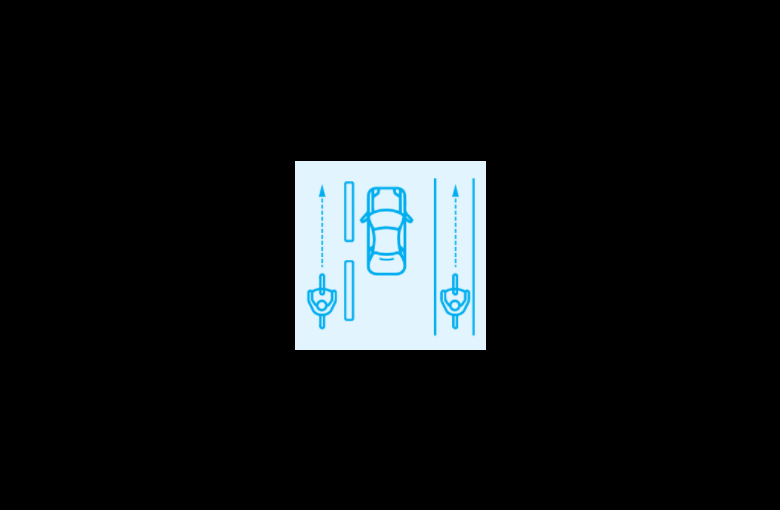
1. Pick a ‘control’ site
It is important to compare new bike lanes with a nearby untreated or ‘control’ site. This allows us to understand outside effects not associated with the bike lane.
If bike activity is low on the new bike lane, but also on the control site, it might be reasonable to suggest some external factors are at play. Heavy rainfall, lockdown restrictions, school holidays, and so on.
Nearby off-road share paths are good examples of control sites. As well as having preexisting bike riding activity that we can compare with, we may also be able to get information on whether people preference for riding on-road or off-road.
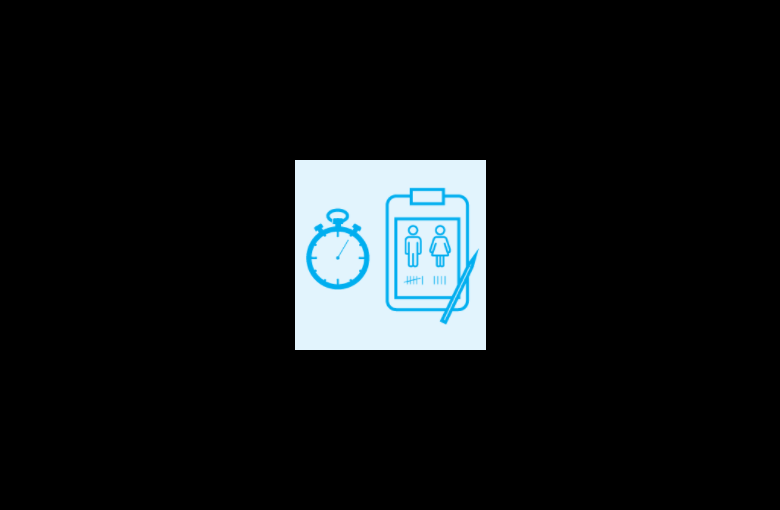
2. Use mixed methods
We shouldn’t just count bikes. As well as quantitative (number-based) data, we should also collect qualitative (descriptive-based) data.
Surveys, for example, are essential for evaluating community attitudes to new bike lane treatments.
And when it comes to counting bikes, we can dig a little bit more. One of the great challenges in active travel is increasing the diversity of people riding bikes and fostering inclusivity. Understanding the demographics of the people riding (age, gender) is therefore equally important.
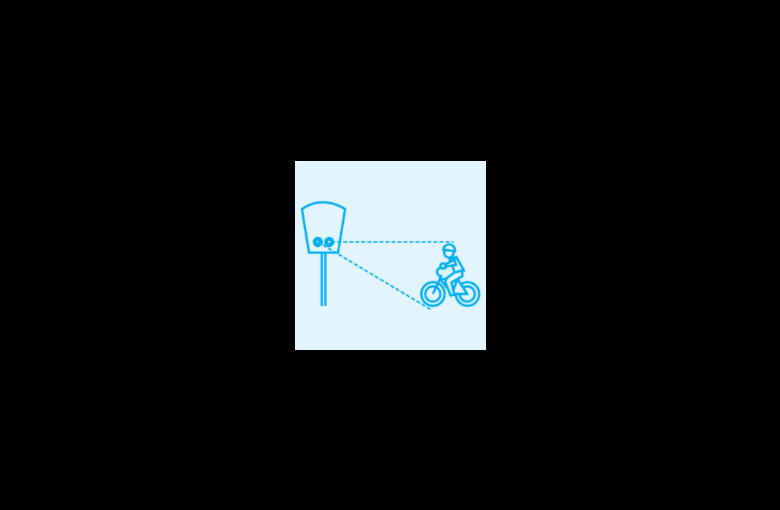
3. Use modern counting technology
We are in the 21st century. It’s time to take things up a notch.
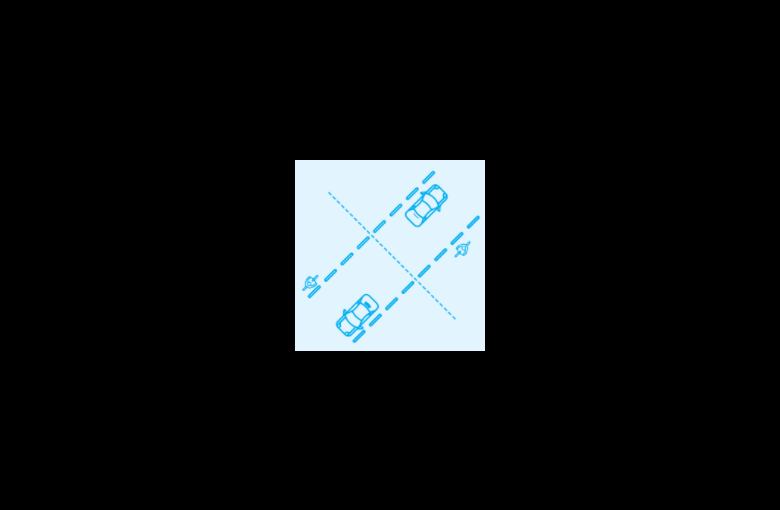
State-of-the-art traffic counting methods, are capable of detecting road users, determining the type of road user, and closely following their trip movements. We have the power to understand road user behaviours like never before.
4. Pick good data collection points
Selecting a good spot to collect data needs to be undertaken carefully.
Consideration should be given to the location of key destinations such as schools, business and retail districts. Zones of high bike riding should be prioritised, so that bike traffic flow behaviours can be monitored.
5. Establish a 12-month timeline
What do rainfall, temperature, school holidays and daylight hours have in common? They change throughout the year, and they will each have an effect on a person’s choice to ride a bike.
Therefore, a fair evaluation should be long enough to accommodate for these factors. A period no less than 12 months will allow for reasonable insights to be made.
With these five key steps in mind, Bicycle Network is campaigning for a fair go for pop-up bike lanes. You can learn more and show your support for pop-ups by visiting our campaign page, or by reading our ‘Monitoring and Evaluation of Victoria’s Pop-Up Bike Lanes’ submission here.
Have you been enjoying Melbourne’s pop-up bike lanes? Send us a photo, or send an e-mail to the Minister for Roads and Road Safety.
This article was made possible by the support of Bicycle Network’s members who enable us to make bike riding better in Australia.
Original article was published on Bicycle Network on 29th April 2021. You can read the original article here
Got a great MetroCount story? Share it with us
