We recently examined seven random MetroCount bike monitoring sites across Australia to assess how COVID has affected cycling and to compare/contrast trends in different cities before, during, and after initial lockdowns.
Six of the seven sites were chosen following the same criteria:
- It had to be located on a popular shared path near a capital city but not in the central business district.
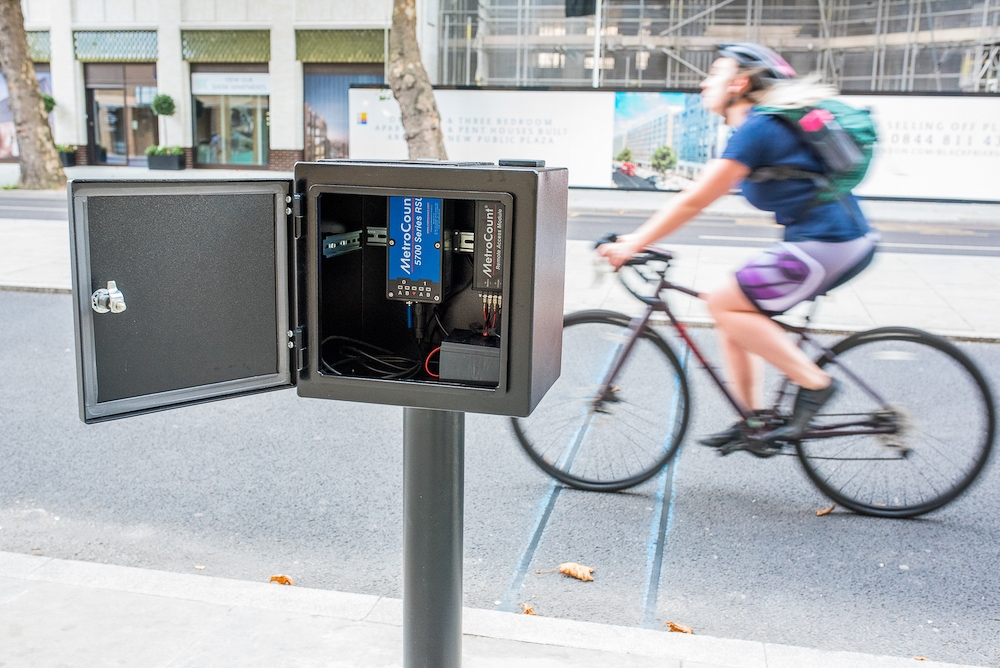
- Bikes must be counted using the same piezoelectric system that records 24/7, 365 days a year.
- The bike counter must have been commissioned at least 6 months prior to the first COVID community transmission in Australia (which occurred on 2nd March 2020).
The last of the 7 sites was specifically chosen to be able to compare and contrast trends with those from a CBD location in a capital city. For this, we chose the Albert Street bike lane in central Melbourne, the city most impacted by COVID over the last 18 months.
Let’s first compare and contrast the sites with each other to get a broad overview of cycling trends across Australia. For more detailed information on each specific site, scroll down further.
Average Weekly Cyclists Before and After COVID
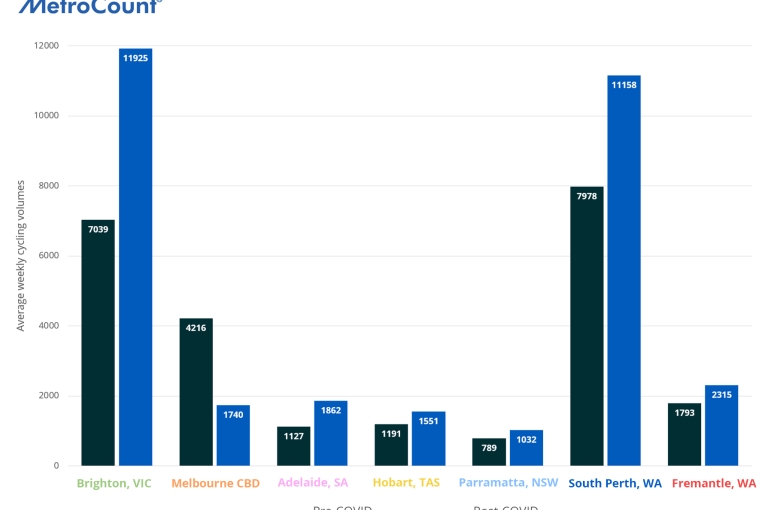
When comparing average weekly cyclist volumes from before and after the first community transmission of COVID, there is an obvious increase in cyclists at all but the Melbourne CBD site. Increases varied from 29% more cyclists in Fremantle, WA to 69% more cyclists along the Bay Trail in Brighton, VIC. This is put down to a few factors:
- Leisure riding increased as more people worked and studied from home.
- Riding for exercise increased due to team sports being cancelled and gyms shutting down.
- Fear of using public transport made cycling an attractive option for socially distant travel, particularly for short trips.
There was a 59% decrease in cyclists using the Albert Street bike lane in Melbourne’s CBD. This is due to both a reduction in people commuting to work and strict COVID lockdowns lasting more than 16 weeks of the total survey period.
Total Weekly Cyclists Over The Years
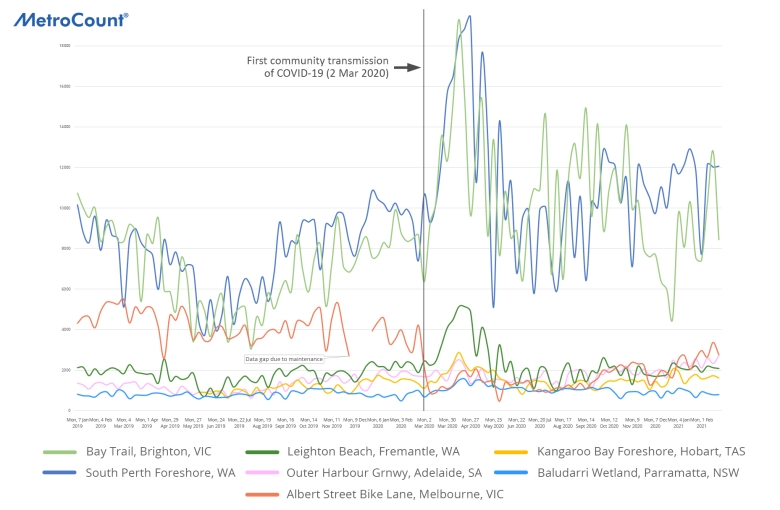
When looking at cycling data from all seven sites over the past few years, it is clear to see that the pandemic has caused a massive shift in trends.
Firstly, the six non-CBD locations each recorded never-before-seen peaks in cycling for the three months following initial community transmission. These increases peaked at up to three times the bike volumes seen during the same period the previous year.
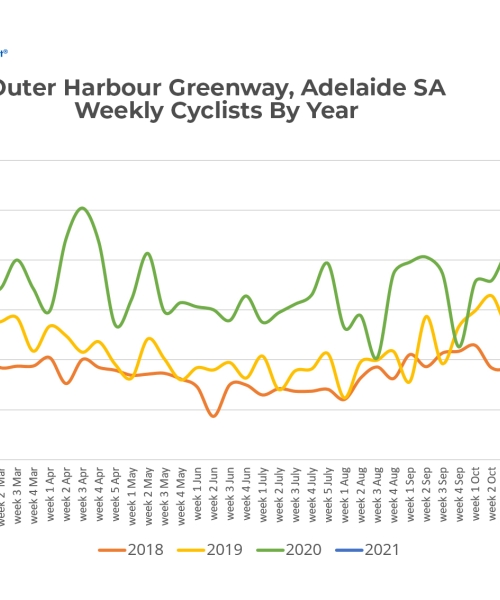
Every one of the non-CBD sites then saw volumes drop down during winter 2020 yet plateau at higher levels than previous years, excluding Adelaide, where volumes continued to increase.
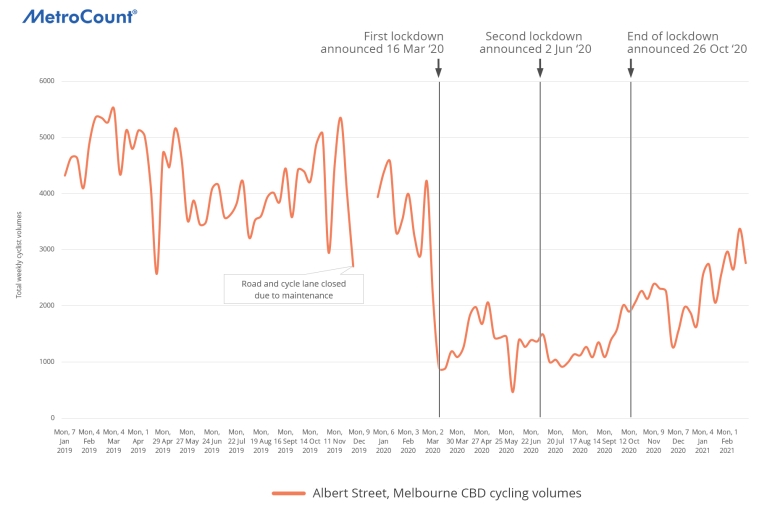
In Melbourne’s CBD, volumes rapidly decreased once COVID hit, initially falling by 400% before plateauing during the second wave of coronavirus and slowly starting to increase again in October when cases started decreasing and the official lockdown ended on 26th October.
As of late February 2021, volumes are still only half of what they were in February 2019.
New mobility mode growth
All MetroCount bike monitoring systems have the in-built capacity to determine the mobility mode of each dual-axle device crossing the sensors. This is done by recording the distance between the two axles and correlating it with standardised wheelbase measurements for different mobility devices.
For this analysis, we used the Shared Path Classification Scheme 2 to differentiate four different mobility modes travelling on the cycleways. See the breakdown of classes in the table below:
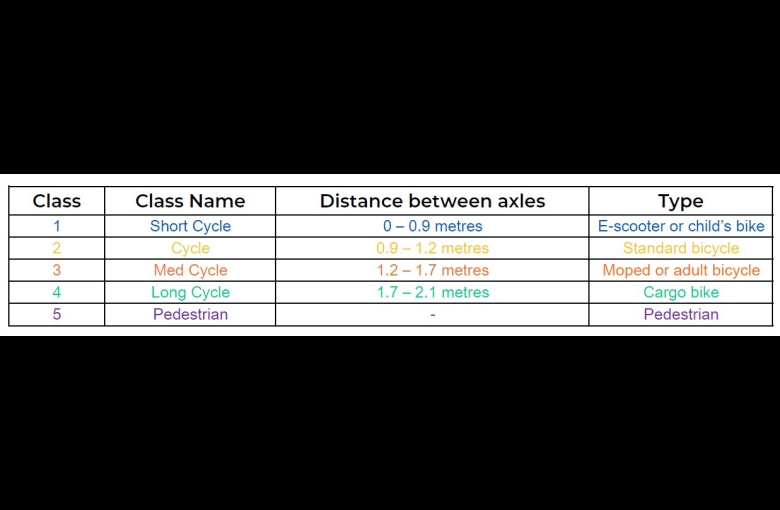
When applying this scheme to each of the seven monitoring sites, we saw a similar trend occur everywhere.
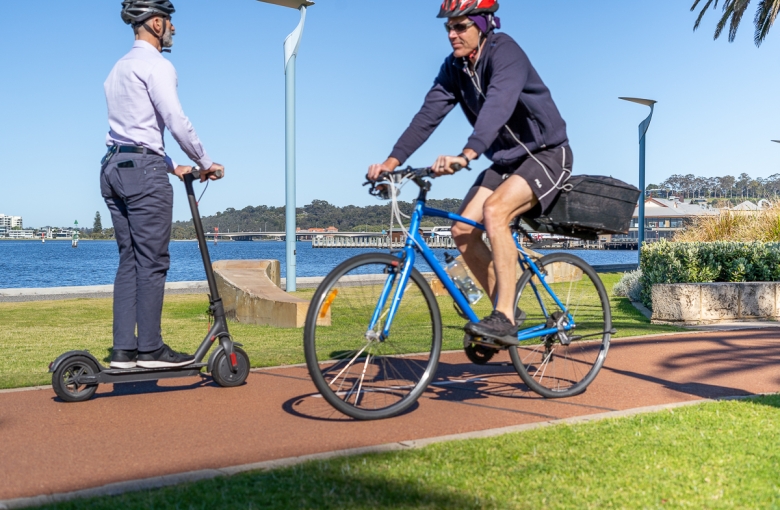
E-scooter boom
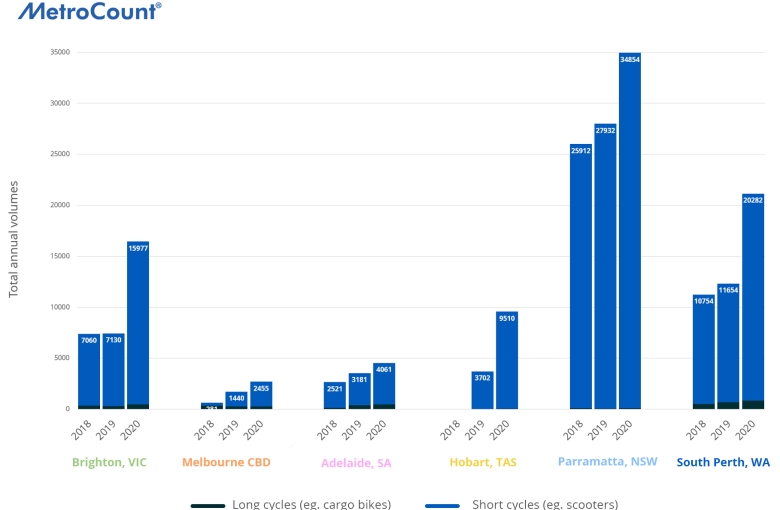
The popularity of short wheelbase devices such as e-scooters exploded, especially from 2019 to 2020. The majority of sites saw a near doubling of these modes with the exception of Hobart which saw almost 3 times as many short-wheelbase devices in 2020 compared to 2019! Following are the percentage increases for each site:
- 124% increase along the Bay Trail in Brighton.
- 70% increase in the Melbourne CBD.
- 28% increase along the Outer Harbour Greenway in Adelaide.
- 157% increase on the Kangaroo Bay Foreshore in Hobart.
- 25% in Parramatta.
- 74% along the South Perth Foreshore.
Interestingly, the highest percentage of short wheelbase devices compared to standard cycles was found in Parramatta (16%) where e-scooters are still illegal, and trials have been cancelled across NSW.
Figures from Kangaroo Bay Foreshore in Hobart show that short-wheelbase device use stands at 14% of standard bicycle use. That is a considerable amount, and although it is legal to ride an e-scooter in Tasmania at under 10km/h, further regulation is not being considered because “e-scooters fall outside of the scope of use in Tasmania.”
What about cargo bikes?
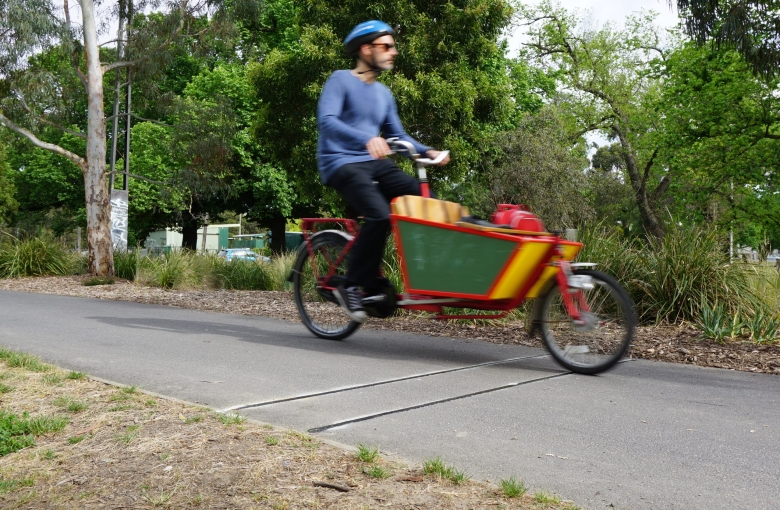
Long wheelbase devices such as cargo bikes also increased significantly in places such as Brighton (47% increase), Adelaide (27% increase) and South Perth (26% increase).
For a more detailed breakdown of cargo bikes at each site, and a look into volumes versus speed and weather correlations in each location, scroll further down.
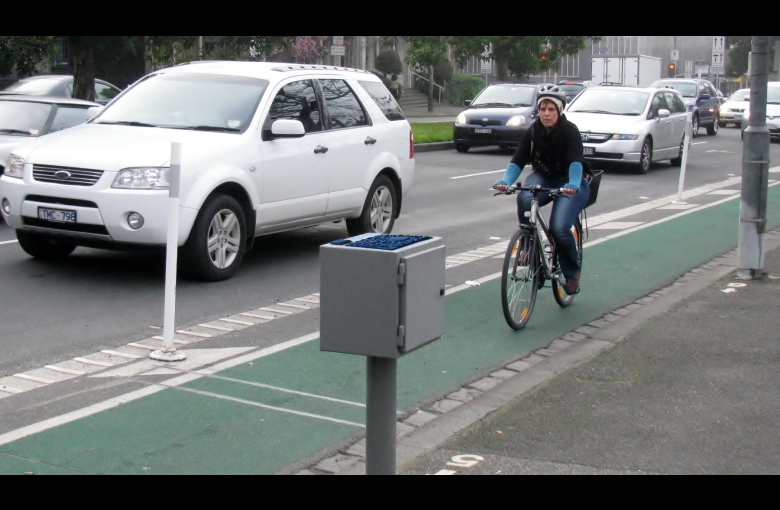
Albert Street bike lane, Melbourne CBD


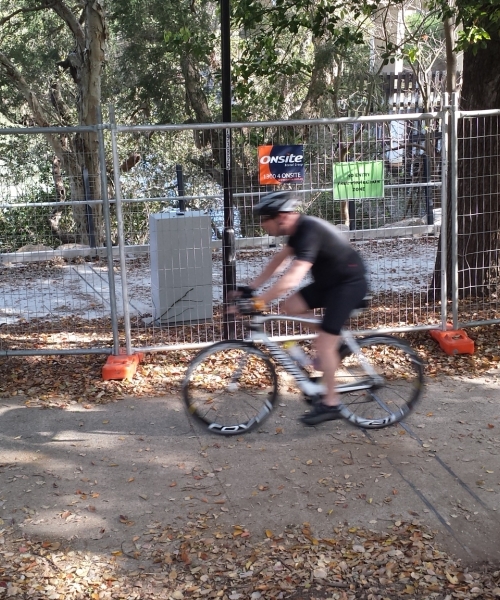
Baludarri Wetland Path, Parramatta


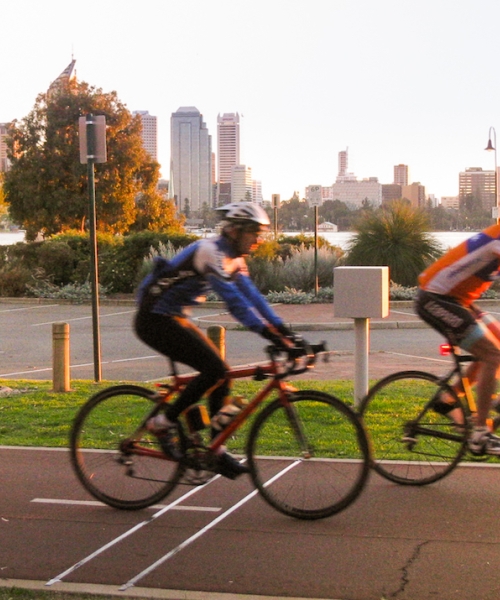
South Perth Foreshore


Kangaroo Bay Foreshore, Hobart
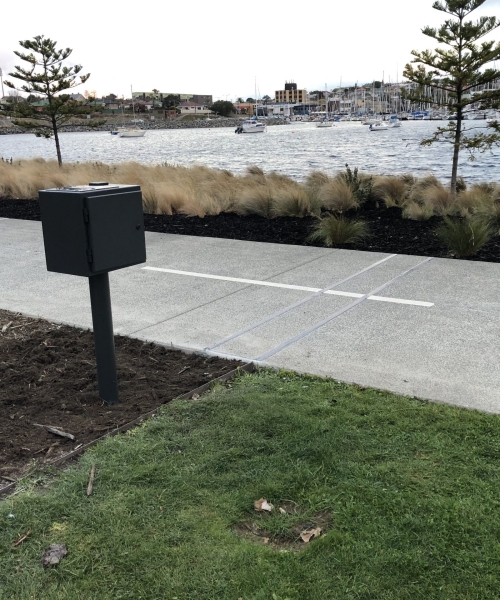


Outer Harbour Greenway, Adelaide


Bay Trail, Brighton, VIC


All information in this article is based on data collected with the RidePod BP bike monitoring system and the ATLYST online analytics dashboard.
Thanks to the City of South Perth, City of Charles Sturt, Clarence City Council, VicRoads, City of Parramatta, City of Fremantle, and Main Roads Western Australia for sharing their data.
MetroCount works with local governments and road authorities globally to monitor road, cycleway, and pedestrian traffic for infrastructure design and road safety.
Got a great MetroCount story? Share it with us and let the world know the great work you're doing in your community.