The MetroCount Signature System

We have created a sophisticated interaction between the MetroCount Vehicle Classifier System hardware and software that allows us to offer a variety of Option Levels (signatures) with different access to reporting features.
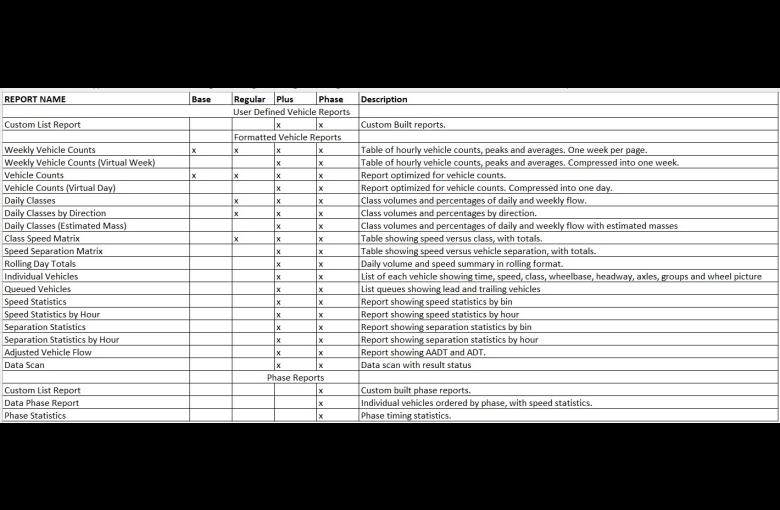
Theses options are:

  • Base
  • Regular
  • Plus
  • Plus Batch

Each MetroCount counter has a unique signature that defines which reports are accessible. One of the best features of the MetroCount Signature System is that you can easily upgrade the Option Level of your Roadside Units, anytime after purchase, via fax or e-mail. We simply supply you with new Authenticity Signatures, then any new datasets you create will have your new Option Level.

One of the best features of the MetroCount Signature System is that you can easily upgrade the Signature of your counter, anytime after purchase. We simply supply you with new signatures, then any new datasets from upgraded counters will have the upgrad capabilitiesies.

Old datasets can be upgraded to the new signature, but only by MetroCount.

Please Note:
Each Roadside Unit Signature is unique and can not be transferred from one Roadside Unit to another. A Roadside Unit’s Signature is stored inside the Unit. The signature is based upon the Roadside Unit’s serial number and therefore can only be installed on the Roadside Unit with corresponding serial code. If a Roadside Unit signature is lost, then MetroCount will re-issue the original Signature without charge.


Report Name Base Regular Plus Phase Description
User Defined Vehicle Reports
Custom List Report X X Custom built reports.
Formatted Vehicle Reports
Weekly Vehicle Counts X X X X Table of hourly vehicle counts, peaks and averages. One week per page.
Weekly Vehicle Counts (Virtual Week) X X Table of hourly vehicle counts, peaks and averages. Compressed into one week.
Vehicle Counts X X X X Report optimized for vehicle counts.
Vehicle Counts (Virtual Day) X X Report optimized for vehicle counts. Compressed into one day.
Daily Classes X X X Class volumes and percentages of daily and weekly flow.
Daily Classes by Direction X X X Class volumes and percentages by direction.
Daily Classes (Estimated Mass) X X Class volumes and percentages of daily and weekly flow with estimated masses
Class Speed Matrix X X X Table showing speed versus class, with totals.
Speed Separation Matrix X X Table showing speed versus vehicle separation, with totals.
Rolling Day Totals X X Daily volume and speed summary in rolling format.
Individual Vehicles X X List of each vehicle showing time, speed, class, wheelbase, headway, axles, groups and wheel picture
Queued Vehicles X X List queues showing lead and trailing vehicles
Speed Statistics X X Report showing speed statistics by bin
Speed Statistics by Hour X X Report showing speed statistics by hour
Separation Statistics X X Report showing separation statistics by bin
Separation Statistics by Hour X X Report showing separation statistics by hour
Adjusted Vehicle Flow X X Report showing AADT and ADT.
Data Scan X X Data scan with result status
Phase Reports
Custom List Report X Custom built phase reports.
Data Phase Report X Individual vehicles ordered by phase, with speed statistics.
Phase Statistics X Phase timing statistics.


Technical details

Leave a Reply

Your email address will not be published. Required fields are marked *

To improve your browsing experience, this website uses cookies.

Cookies are small text files that enable us to record your website usage in accordance with our privacy policy.
Please confirm if you accept our tracking cookies.