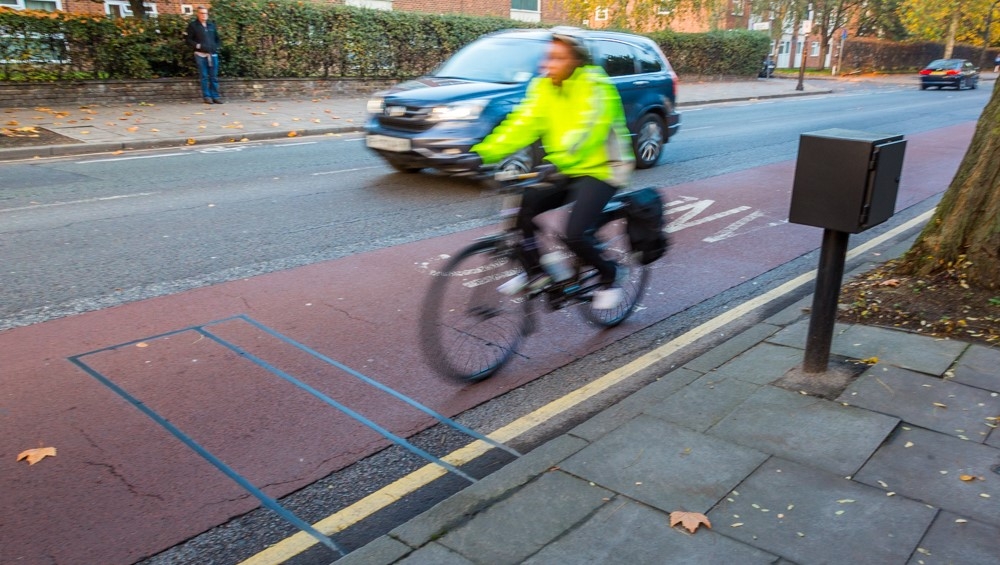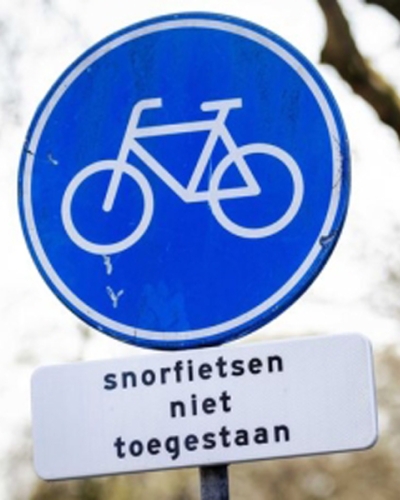
Since 1974, the ‘light moped’ was legalised in the Netherlands and allowed to share cycling lanes with bicycles. These mopeds are mechanically controlled not to exceed 25km/h and are required to display a blue number plate.
Over recent years, the ‘snorfiets’ (purring bicycle) as the Dutch name them, became more and more popular. People wanted the benefit of not having to mix with road traffic as well as not wear a helmet. At their peak, nearly 60,000 people used scooters to commute in Amsterdam alone, with over a million light moped riders countrywide.
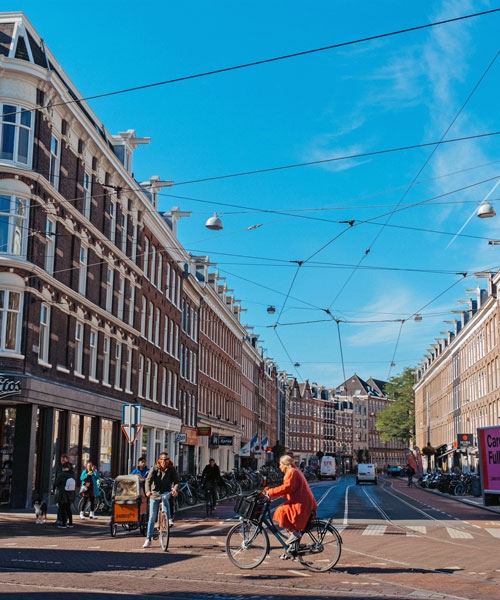
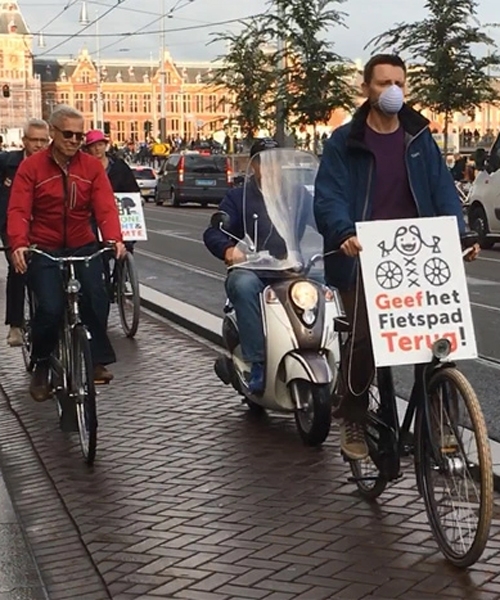
With both cycling and light moped use on the rise, safety concerns were raised and cyclists began protesting against light moped use of bike paths.
Below, we hear from Robert Mulder, Traffic Surveyer at MetroCount Netherlands about how the data was collected and the results it highlighted:
Should we ban mopeds on bike paths?
Due to increasing crashes involving light moped riders, we were approached by the Municipality of Amsterdam in April 2018 to conduct traffic surveys on 40 cycling paths to determine:
- Percentages of cyclists and light moped riders using each path.
- Average speeds of each vehicle type.
Amsterdam had a deadline – a decision had to be made within a month of them approaching us to conduct the study. For us, that meant placing 80 bike counters/classifiers at 40 different locations across central Amsterdam within 2 days! Quite the task, but we managed to complete the installation on schedule.
Monitoring Equipment Used
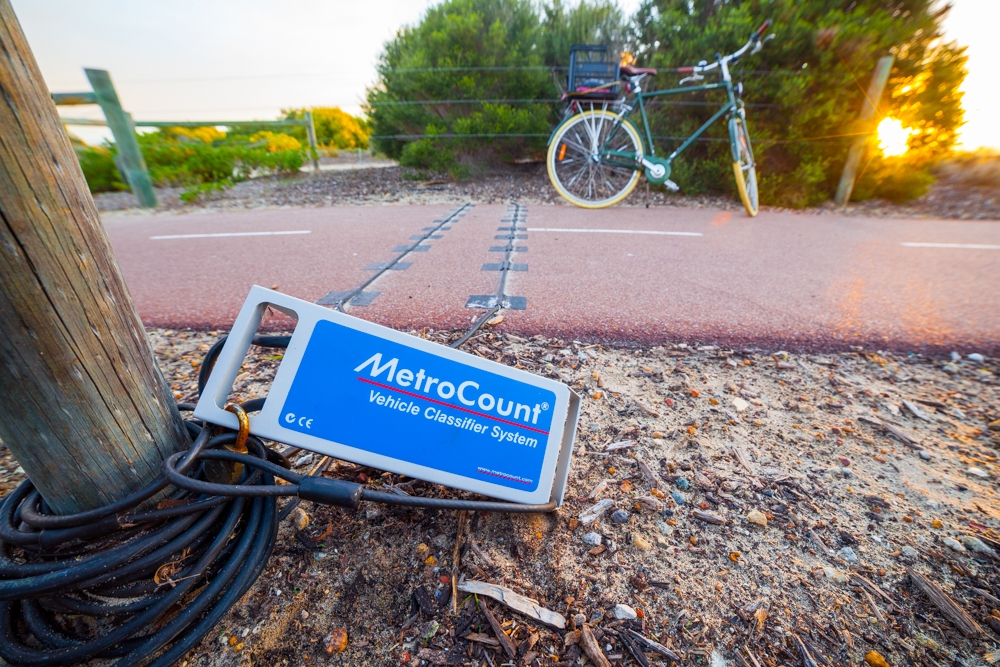
The main challenge in these sorts of surveys is differentiating what is a cyclist and what is a light moped rider. We were able to use our bike monitoring technology and algorithms to measure the distance between each vehicle’s axles and correlate it with speed trends to differentiate the two.
From our experience surveying traffic all over Europe, we knew that using two, thin-walled pneumatic tubes as sensors would be the best method to detect the bicycles and light mopeds. The system needed to be portable and record individual vehicle data with extreme accuracy. That’s why we chose the RidePod® BT system.
The Bike and Moped Survey
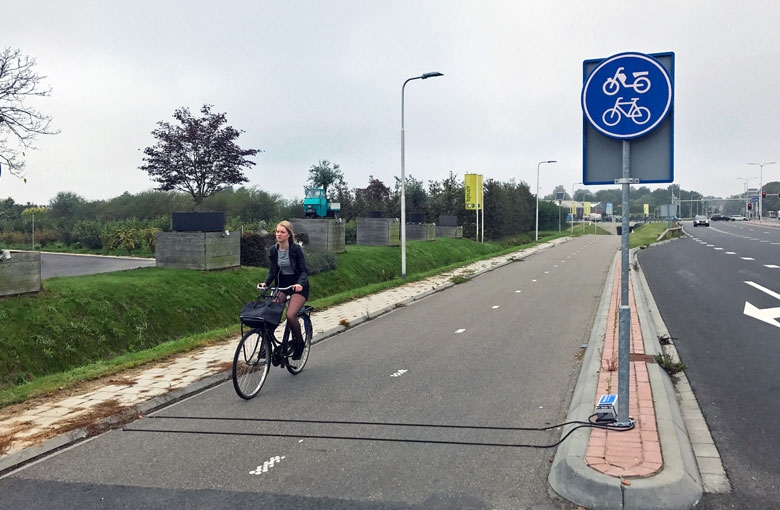
We installed the counters and collected data for a full 7 days so that we could represent both weekday and weekend traffic. The surveys were checked during the week to ensure data was recorded correctly and continuously.
These checks were done by visiting the sites by bike to inspect the tube sensors. Nowadays, we'd be able to do this from the office by connecting to the counters remotely.

What did the data show?
Once all 80 counters had been out for the full week, we processed the data into tables and graphs highlighting the findings. We created a customised heat map to easily visualise axle spacings in relation to speeds and vehicle volumes.
This made it immediately clear how big the speeding problems were at each location and gave the Municipality of Amsterdam an excellent foundation to support a ban on light mopeds.
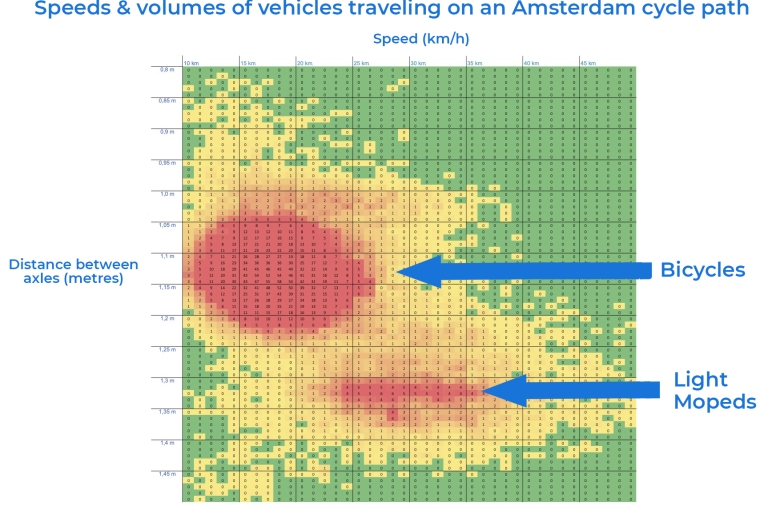
By collecting time-stamped data on every vehicle, we could clearly see two separate class types with different axle spacings.
The first class generally had axle distances of between 80cm – 1.2 metres. We can confidently say these would be bicycles. The average speeds for these bicycles was around 15km/h across all paths.
The second distinct vehicle class sported axle spacings of between 1.25 – 1.4 metres. These vehicles tended to travel roughly 10-15km/h faster than bicycles, with some travelling up to and even over 50km an hour. Well above the limit of 25km/h.
Amsterdam After The Ban:
After receiving our reports, the decision was made to ban all light mopeds from using Amsterdam bike paths starting from April 8th 2019.
Since then, the Municipality of Amsterdam has shared that moving the mopeds onto public roads had a positive effect on both road safety & the flow of traffic.
The number of crashes involving light mopeds decreased from an average of 100 in previous years to just 29 in 2019!
Travel time analysis also showed that the ban did not negatively impact traffic flows on roads or public transport. And to top it off cyclists feel safer & happier travelling on bicycle paths.
When I walk and cycle through the city today, a year after the ban, there’re considerably fewer light moped riders than before. The quality of life on cycle paths has improved and people feel safe to cycle again.
Got a great MetroCount story? Share it with us and let the world know the great work you're doing in your community.