

Remote traffic monitoring solution in an Area of Outstanding Natural Beauty
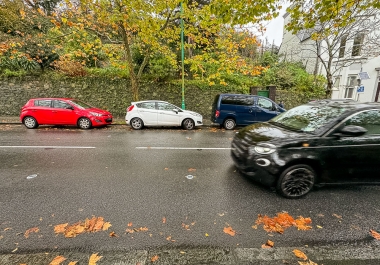
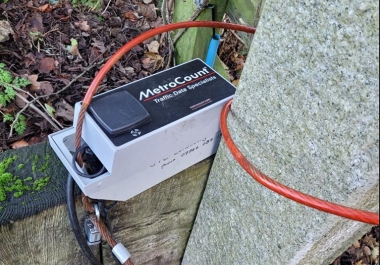
The States of Guernsey (UK) has successfully transitioned from manual downloads to real-time traffic data through the implementation of VM-I real-time traffic counters across four main arterial rou

In today’s interconnected world, the rapid expansion of AI-driven traffic counting cameras is transforming the landscape of urban mobility.
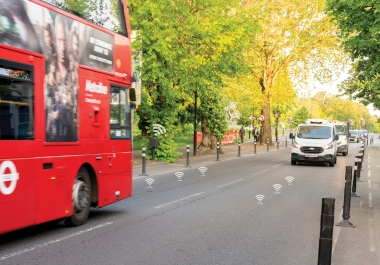
In recent years, traffic monitoring has entered a new era with the emergence of wireless traffic counter technology.

Bike Cochrane is a not-for-profit, volunteer-run organisation making massive headway in creating a cycling-friendly culture in Cochrane, Canada.

Vehicle classification systems are crucial in traffic monitoring, road design, and infrastructure planning.