The coronavirus hit New York City hard and fast. Night-time subway closures, stay-at-home orders, pop-up hospitals and 23,861 COVID-19 deaths has left the city “feeling like a warzone” at times.
Through it all, however, the bicycle has remained a reliable mode of transportation for essential workers, a socially distant way to exercise and a lifeline to the many who’ve lost their regular jobs and now make a living with bike delivery services.
COVID impact on cycling
Cycling numbers are booming. An automatic bike counter on Brooklyn’s Columbia Street bike path has monitored bicycles 24/7 for over 5 years. From 2015 to 2019, the average weekday traffic volume was steady at around 680 daily bikes. In 2020, this figure skyrocketed to 1,054.
The average weekend bike traffic almost doubled in 2020 (1,473 bikes a day) compared to 2019 (793 bikes a day), indicating that leisure riding has increased dramatically in the area.
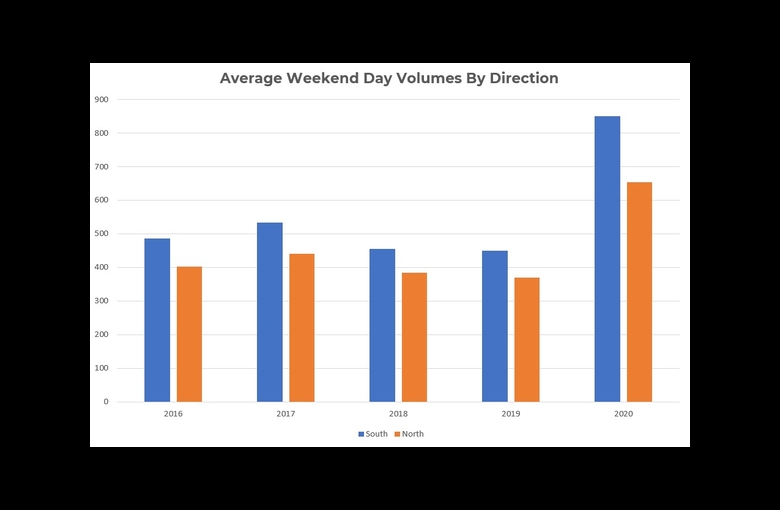
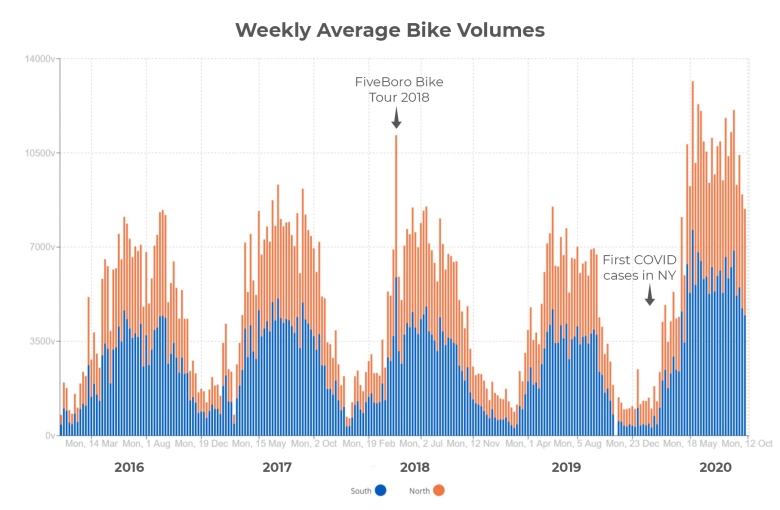
These increases are particularly noticeable in the months from May to October 2020 (see dark blue line in the graph below) when COVID restrictions were in place.
A visible reduction in usual rider volumes occurred during late January and February 2020 despite average weather conditions but coinciding with the first COVID cases and deaths in the USA.
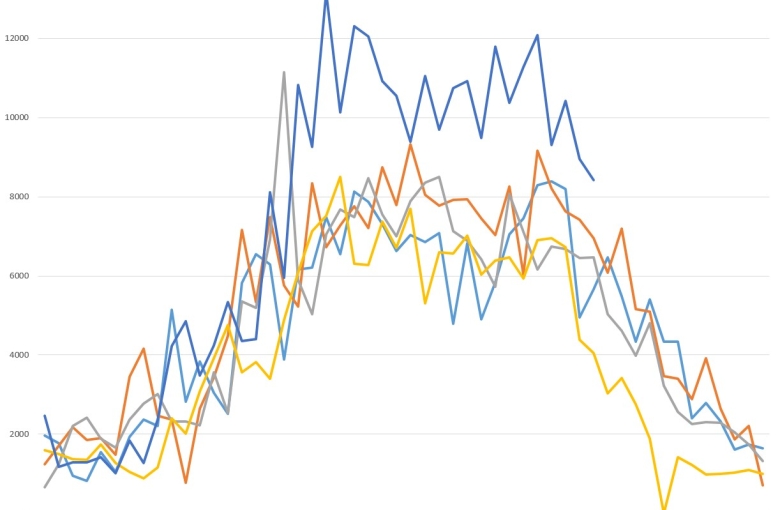
Prior to 2020, only once before have weekly rider volumes surpassed 10,000 – this happened in the first week of May 2018 when the FiveBoro Bike Tour took thousands of riders along a section of Columbia Street just north of the bike counter (which recorded 11,155 bikes that week).
In 2020, weekly rider volumes have surpassed 10k fifteen times, including the busiest week on record with 13,161 bicycles passing the counter between 25th May and 1st June 2020.
Rider behaviour changes
When looking at virtual weekdays and weekend days (average hourly volumes across a 24-hour period), we can see how rider behaviour changed dramatically in 2020.
On weekdays, the usual morning peak period of between 7-10 am has reduced in volume compared to other years. This trend reflects the massive drop in morning commuters as people work and study from home.
Conversely, the afternoon peak is totally different from previous years, with volumes starting to grow from around 11 am (compared to 4 pm) and only drop back to normal levels around 9:30 pm.
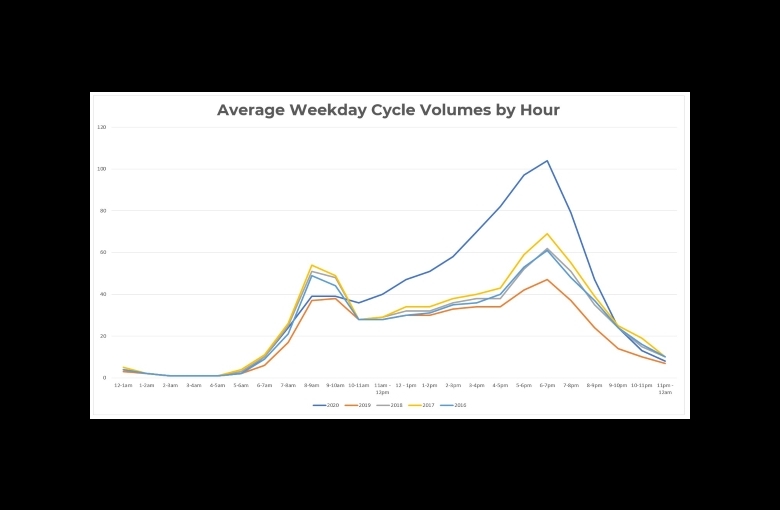
This trend is most likely a combination of exercise riders who cannot use gyms or play team sports anymore, along with a boom of bicycle delivery riders transporting food and other items as restaurants and businesses are restricted to take away orders only.
Afternoon volumes peak at over 100 bikes an hour between 6-7 pm compared to around 60 bikes an hour in previous years.
Weekend cycling speeds and volumes
When looking at a virtual weekend day we see an extended peak in 2020 with volumes hitting 170 riders between 3-4 pm compared to under 100 riders during the same hour in all previous years.
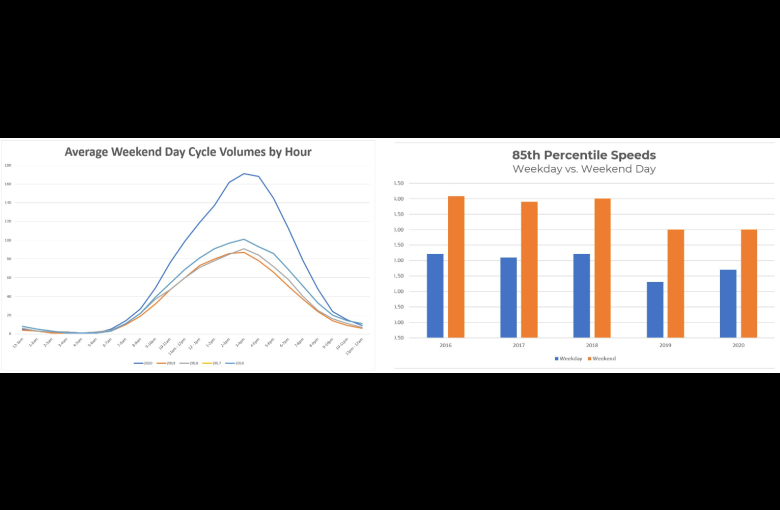
When comparing weekdays with weekend days an apparent difference in 85th percentile speed is also evident. Weekend day riders consistently travel around 2kms an hour faster than weekday riders, continuing throughout coronavirus restrictions.
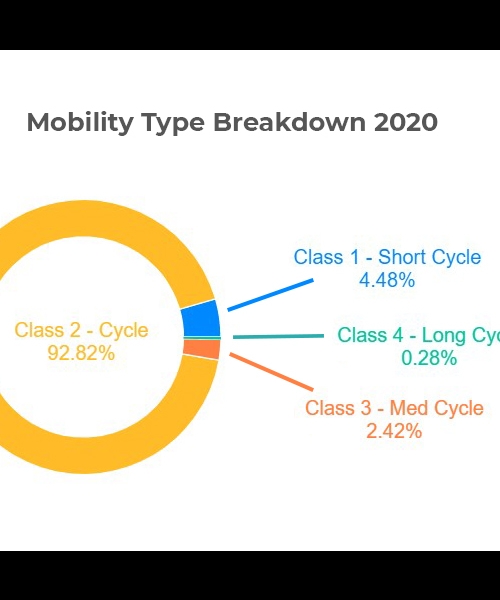
The bicycle counter installed in Brooklyn offers extremely detailed information on riders, including which type of mobility device they’re travelling on (based on the length detected between axles).
This allows us to monitor trends such as increases in e-scooters or cargo-bikes and to detect if motorcycles are illegally using bike paths.
Analysing rider data in detail is extremely important for governments to plan for demand and ensure cycling infrastructure is safe for all mobility types.
The same permanent bicycle counter installed in Brooklyn was also used in other cities during the pandemic to count bicycle and pedestrian numbers and ensure adequate socially distancing on shared paths.
Understanding active transport movements in such detail is extremely important now more than ever. Cyclist and pedestrian numbers have increased across the globe and monitoring their behaviour is paramount to gaining funding, ensuring safety and supporting continual growth into the future.
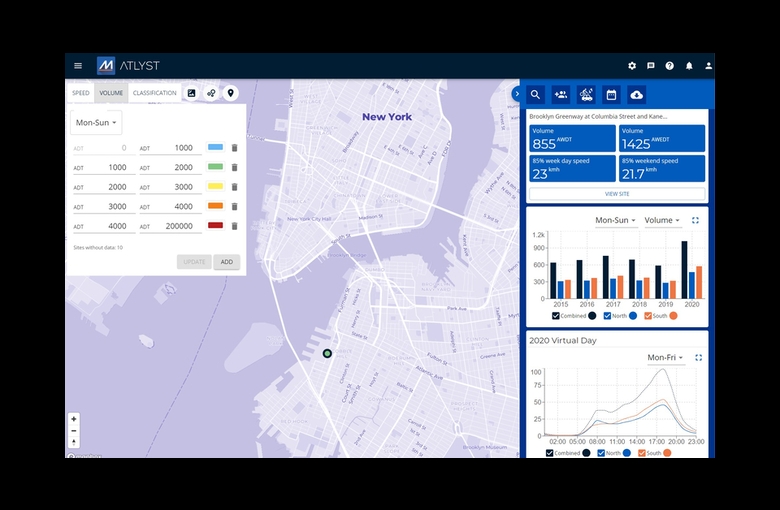
ALl data referred to in this article was collected using the RidePod BP piezoelectric bike monitoring system. Analysis and graphs were produced using ATLYST online data analytics platform.
Got a great MetroCount story? Share it with us and let the world know the great work you're doing in your community.