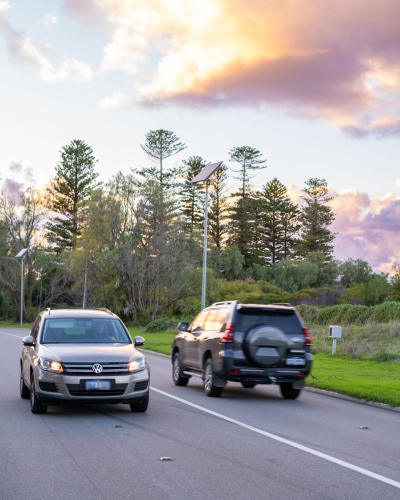
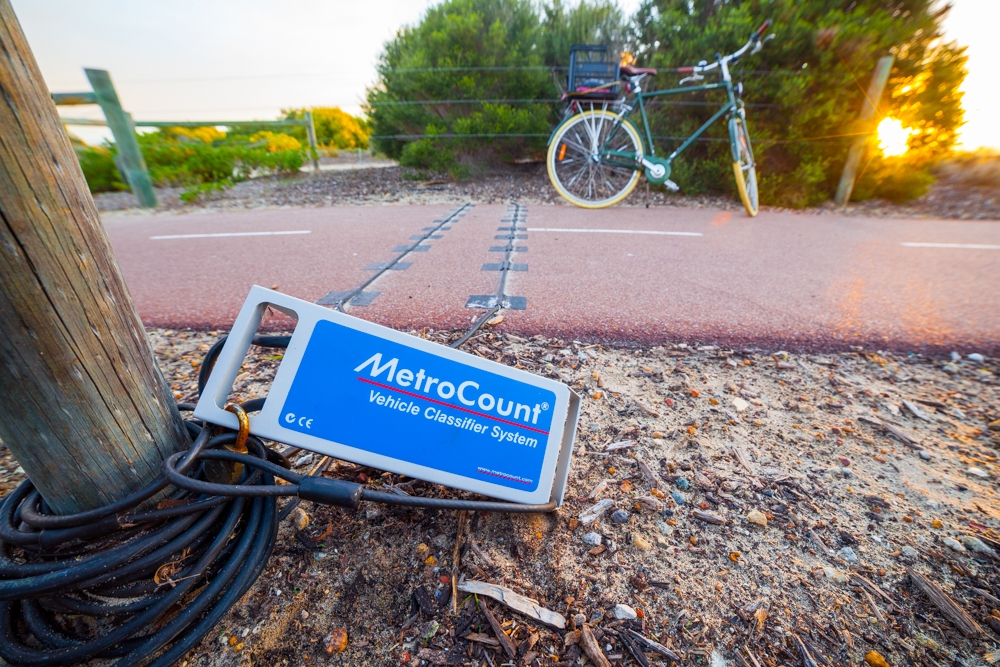
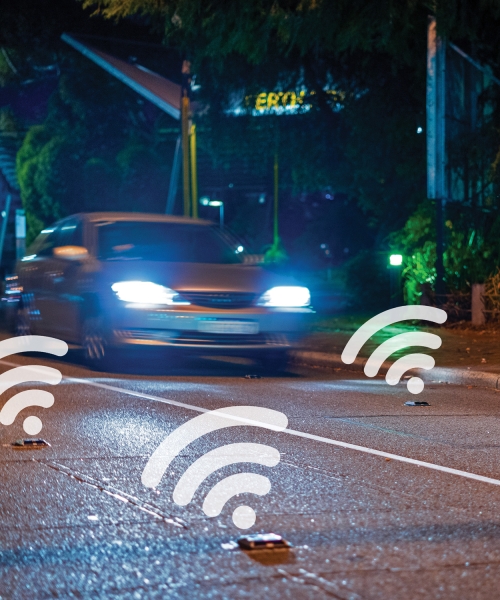
The technology uses solar-powered magnetometers embedded in cat’s-eye studs that are installed in arrays along the middle of a traffic lane. The system time-stamps every single vehicle and records its length, speed and direction.
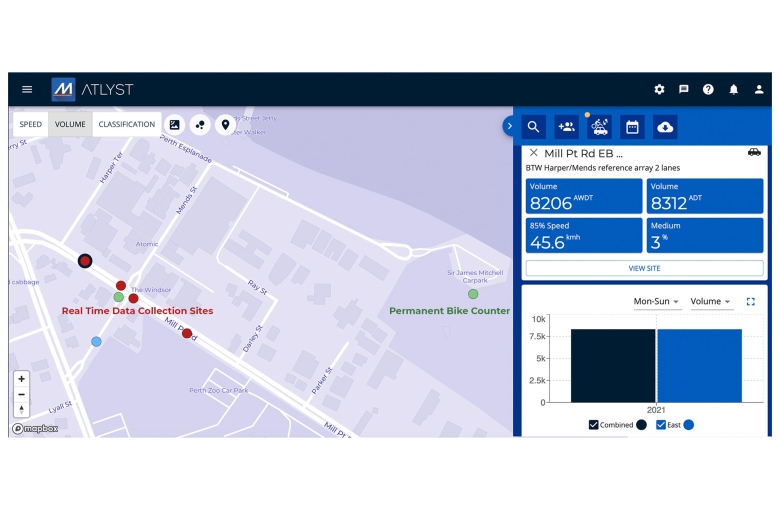
This information is then sent in real-time to MetroCount’s ATLYST online analytics dashboard where data is clearly displayed on a map, in automated graphs or customisable reports.
Real-time traffic data in South Perth
In a joint project between Main Roads Western Australia, the City of South Perth and MetroCount, this new technology was installed in January to monitor the Mends Street and Mill Point Road intersection.
Unbeknownst to everyone, the installation captured by the extremely unusual vehicle movements caused by a last-minute announcement of a full COVID lockdown.
The data painted a picture in real-time of the last-minute scramble for supplies on Sunday evening, followed by five days of extremely reduced vehicle volumes that reveal interesting information about local traffic movements.
Let’s take a closer look at the data that was collected.
The area around the Mends Street and Mill Point Road intersection is a mix of residential buildings, parklands, offices, restaurants and the South Perth Zoo. Mill Point Road connects to the Kwinana Freeway just west of the intersection.
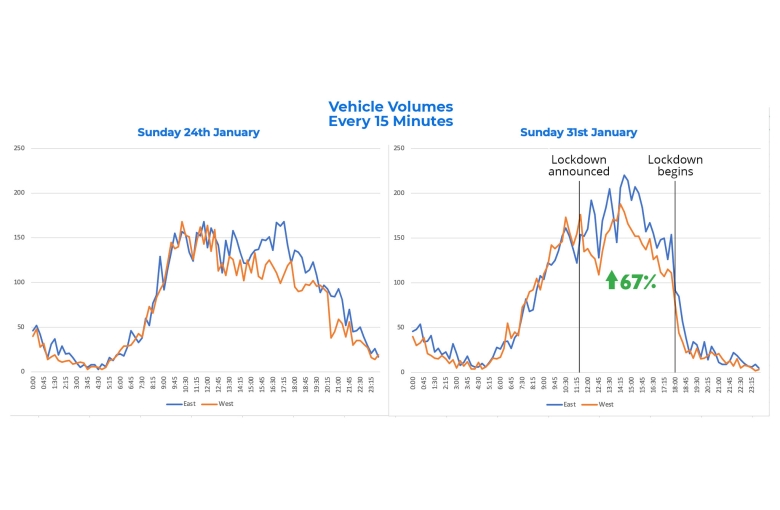
When looking at a graph of traffic volumes on a normal Sunday, an extended peak is visible between 9 am to 1 pm as residents enjoy a leisurely weekend.
Westbound traffic then declines for the remainder of the day while eastbound traffic sees a shorter peak at around 4 to 6 pm as people likely return home from the day’s activities off the Kwinana Freeway.
When looking at hourly traffic volumes from Sunday 31 January, however, we see a very different story. In the morning we observe a similar trend to usual until 11:30 am when the State Premier announces a COVID hard lockdown starting at 6 pm on the same day.
Vehicle volumes in both directions increase drastically until around 3:30 pm as residents rush to buy supplies, return home and organise themselves for the 5-day lockdown to come. Traffic starts to reduce slightly at 4 pm until volumes drop off entirely as the lockdown kicks off at 6 pm.
The busiest hour on the road was between 2 – 3 pm with a total of 785 vehicles travelling eastbound and 702 vehicles travelling westbound. Generally, the busiest hour on a Sunday would only see volumes reach 550-600 vehicles, and only ever during the morning (usually from 10 -11 am). To put it into perspective, that’s a 36% increase in Sunday peak hour traffic and a 67% increase in usual Sunday volumes between 2 – 3 pm.
The effect of hard lockdown on traffic volumes
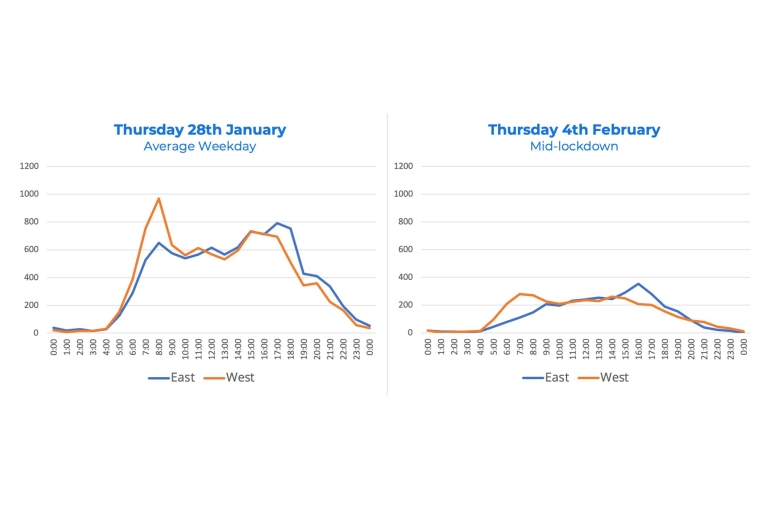
Let’s take a look at traffic volumes from Sunday, 31st January at 6 pm to when the hard lockdown finished on Friday, 5th February at 6 pm. Only essential travel for work, medical reasons or essential supplies was allowed under the lockdown rules. From the graph below, it is clear to see the massive impact this caused on traffic volumes.
For the 3 weeks prior to the lockdown, average weekday traffic was 9,344 vehicles travelling eastbound and 9,236 vehicles travelling westbound. During the hard lockdown, these averages dropped to 3,120 vehicles travelling eastbound and 3,602 vehicles travelling westbound. That’s 33% and 39% of normal traffic volumes, respectively.
When looking at a graph of hourly volumes on an average Thursday compared with that of the 4th of February (mid-lockdown), the drastic reduction is clearly visible. Also notable is the disappearance of the usual eastbound morning peak and westbound afternoon peak.
Lockdown’s effect on cyclist volumes
Just a couple hundred metres from the Mill Point Road and Mends Street intersection, a permanent bike counter is installed on the South Perth foreshore share path.
The bike counter similarly recorded a drop in cyclist volumes during the hard lockdown, averaging 1,241 a day compared to the calendar year average of 1,615 a day. That’s 77% of usual weekday cyclist volumes – a much less noticeable drop than what transpired at the traffic intersection.
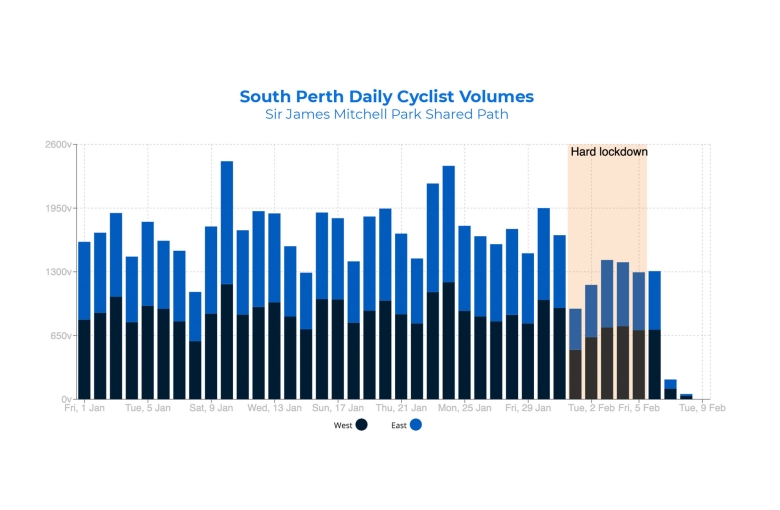
Although commuter cycling likely dropped significantly, this was countered by a potential increase in leisure and/or exercise cyclists and those choosing to ride instead of catching public transport for essential travel due to COVID-related concerns.
This theory is backed up when comparing hourly cyclist volumes on an average weekday with the same data collected during the lockdown. The more pronounced morning peak of a usual weekday was reduced and softened during the lockdown along with a higher percentage of use during the middle of the day and almost no reduction in the afternoon peak.
Effect of reduced volumes on average speeds
So does the drastic reduction in traffic volumes have any impact on speeds? Let’s take a look at the data.
Firstly, it’s important to note that vehicles travelling eastbound have just passed through another busy intersection only 180 metres before the Mill Point Road and Mends Street intersection. This means average speeds eastbound are generally lower than average speeds westbound where traffic is freer-flowing.
For the three weeks prior to lockdown, average weekday traffic speeds were 33.5 km/h eastbound and 42.8 km/h westbound. During the 5-day hard lockdown, these averages increased to 38.8 km/h and 48.8 km/h, respectively. That’s a 16% increase eastbound and 14% increase westbound.
When looking at a graph of average hourly speeds, it is also evident that usual morning and afternoon reductions in speeds caused by congestion did not occur during the lockdown.
In the weeks prior to the lockdown, average speeds westbound had a tendency to drop to as low as 25.5 km/h, especially during the morning rush. During the 5-day hard lockdown, average speeds did not drop below 45 km/h for the entire week.
Benefits of real-time traffic data collection
While analysing vehicle movements on a weekly or daily basis is generally sufficient for most traffic-related projects, the ability to recognise driver behaviour and traffic flows in real-time can be extremely useful to:
- Manage traffic congestion;
- Monitor the entry/exit of vehicles to car parks, at tolls or into parks/tourist attractions;
- Monitor the flow of traffic at state and/or country borders;
- And measure the effectiveness of lockdowns, curfews or road closures during critical times.
In this case, government agencies such as the City of South Perth, Main Roads WA and local police were able to ensure in real-time that the lockdown regulations were indeed being followed.
Got a great MetroCount story? Share it with us and let the world know the great work you're doing in your community.
