A recent traffic survey on a Paris shared path has changed the game in tube data collection by becoming the first survey of its kind to differentiate active travel modes such as:
- E-scooters,
- Bicycles,
- Mopeds,
- Cargo bikes.
The technology used to collect the data measures each vehicle’s wheel-base with 2 rubber tubes and classifies depending on the distance between the two axles. Other information collected included time-stamped volumes, speed and the direction of each classified vehicle.
The survey
The survey was conducted on a shared moped (motorised scooter) and bike lane in a mixed business/residential suburb of Paris. The bike counter was placed just north of a busy metro station where trains run to the city centre.
The survey was separately validated with several hours of video footage, confirming data quality.

When analysing the data it is clear to identify daily, weekly and monthly trends including:
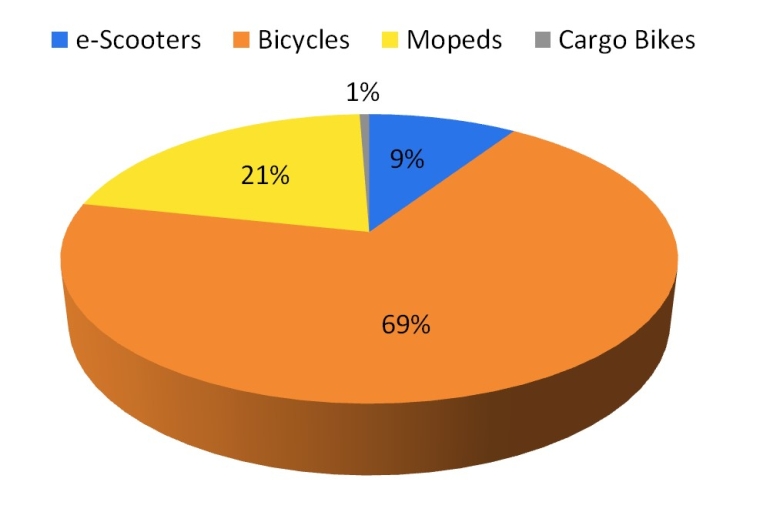
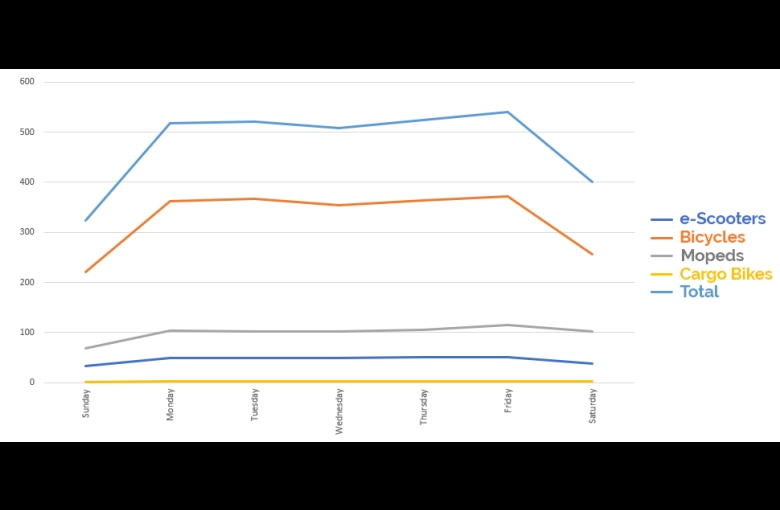
- most path users ride conventional bikes (69.1%), followed by mopeds (21.1%), e-scooters (9.3%) and cargo bikes (0.6%);
- strong trend of increased speeds during the night;
- preference for south-bound journeys (more than double south-bound traffic than north-bound traffic);
- the majority of users are likely commuters as opposed to leisure-riders.
What is the data useful for?
This sort of detailed information can be successfully used for many means, including:
- to better regulate e-scooter use & laws
- to inform future infrastructure upgrades
- to encourage active transport
- to better maintain the path
- to bolster funding applications
- to monitor hazards or speed-related issues along the path
- and to measure the transport mode shift from cars to alternative transport
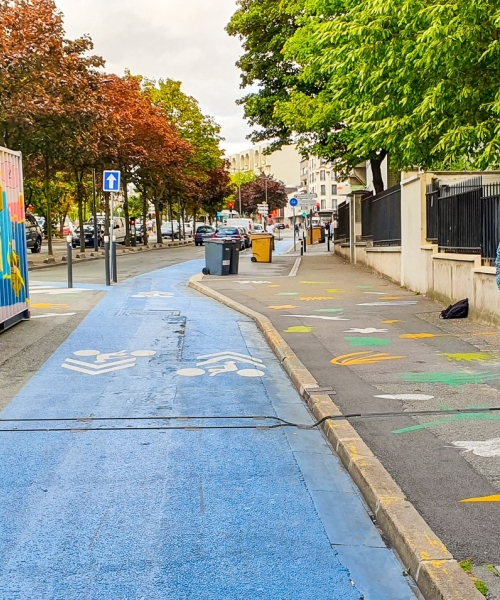
Being able to differentiate active travel modes such as e-scooters from bikes is revolutionary in monitoring safety and speed issues. Recently, Amsterdam banned mopeds from using cycle paths, after carrying out similar surveys with the same technology.
Likewise, differentiating e-scooters from bikes is just as important. Let's have a look at the data gathered!
Differentiating active travel modes by time of day
Median Daily Volume (north-bound)
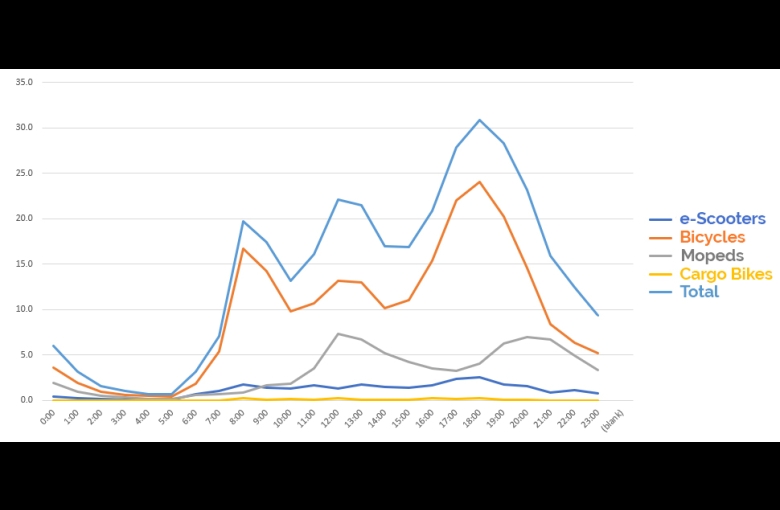
Three peaks are clearly visible on an average day for southward bound traffic. These peaks potentially correlate with the morning commute, an extended lunch break, or Parisian siesta, and the evening commute.
It is interesting to note south-bound volumes increase during the day and are considerably more than north-bound traffic. This is possibly due to the nearby Metro station and to a gradual downwards slope when heading south.
Median Daily Volume (north-bound)
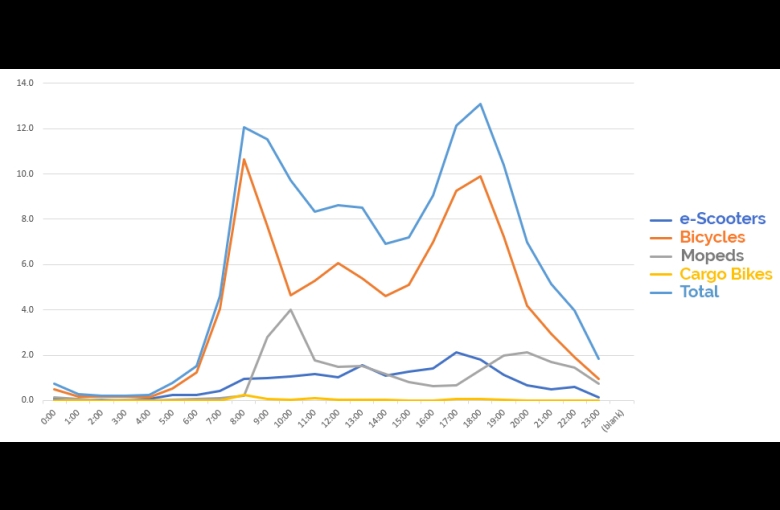
Clear differences appear when we examine north-bound traffic compared to south-bound. Here we see a much less pronounced midday peak and less than half the volume of south bound traffic. This could be due to nearby alternative northbound routes that, although slightly longer, do not have as steep a slope.
A clear peak in moped use appears from 8am to 11am, as opposed to south-bound mopeds that use the path primarily between 11am – 2pm and from 7pm to 10pm.
Total monthly volumes over Summer
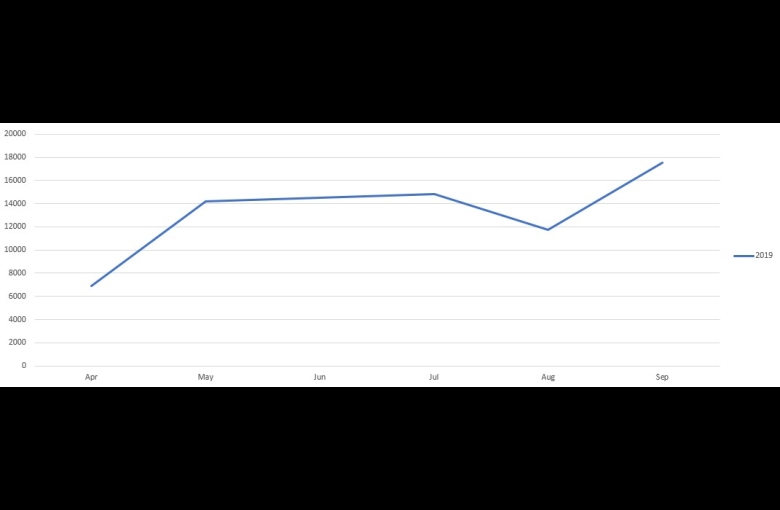
The above graph shows the total volume of vehicles using this path over the European Summer of 2019. A dip in volumes in August correlates with business closures over the summer holiday period.
Note – the survey began mid-April, explaining the dip in volumes for that month.
It would be interesting to continue the survey permanently to capture seasonal trends and long-term growth.
Daily average speeds by hour
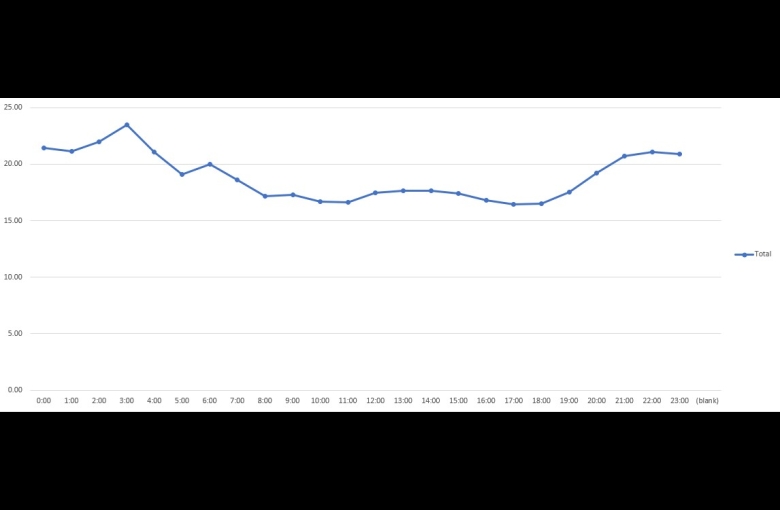
A clear trend of average increased speeds between 8pm and 5am is apparent in the above graph.
Weekly volumes (both directions)
Got a great MetroCount story? Share it with us and let the world know the great work you're doing in your community.
