Bike Data Reveals Cycling Boom in Fremantle during COVID-19
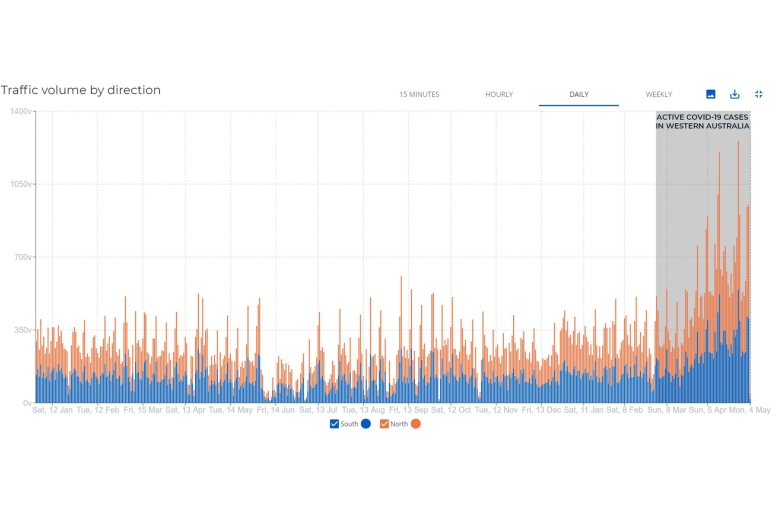
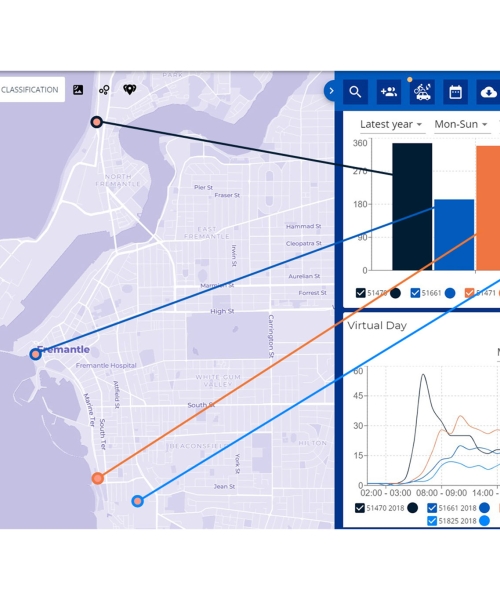
Upon uploading historical data from Fremantle’s permanent bike data and monitoring sites into ATLYST, it became very obvious that cyclists had in some places tripled during 2020 compared to volumes from the same period in 2019.
These increases have been associated with a streak of sunny weather, people working from home due to COVID-19, closures of all gyms and sporting facilities and restrictions on leaving the metropolitan region for non-essential travel.
This bike data was clearly visible on Fremantle’s ATLYST map and able to be filtered to a certain time range and direction of travel, as shown on the graph above.
ATLYST also made it very easy to compare multiple survey site statistics in one view.
This allowed the City to put provisions in place to encourage social distancing on busy share paths and identify which areas required attention to ensure path infrastructure could cope with the increased demand.
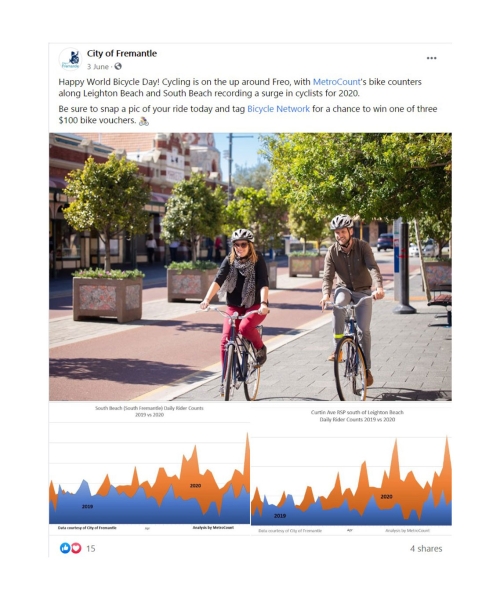
“MetroCount’s bike counter at Leighton Beach saw 230 average daily riders between June ’19 – Feb ’20 increase to a daily average of 740 between April and May this year!"
Identifying bike lane user types
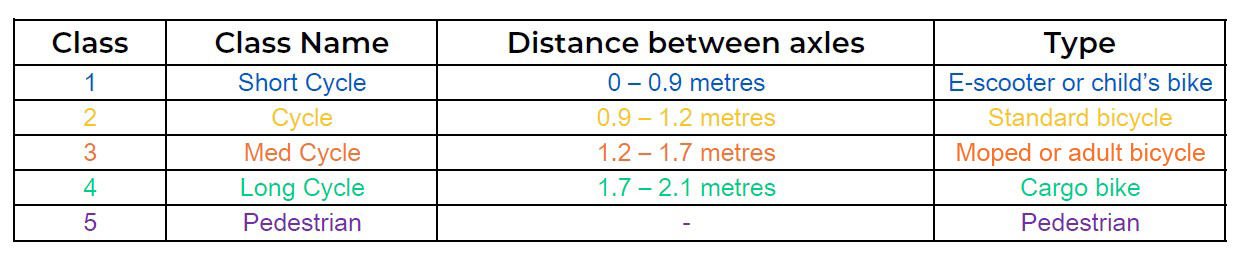
The City of Fremantle was also able to distinguish what percentage of these riders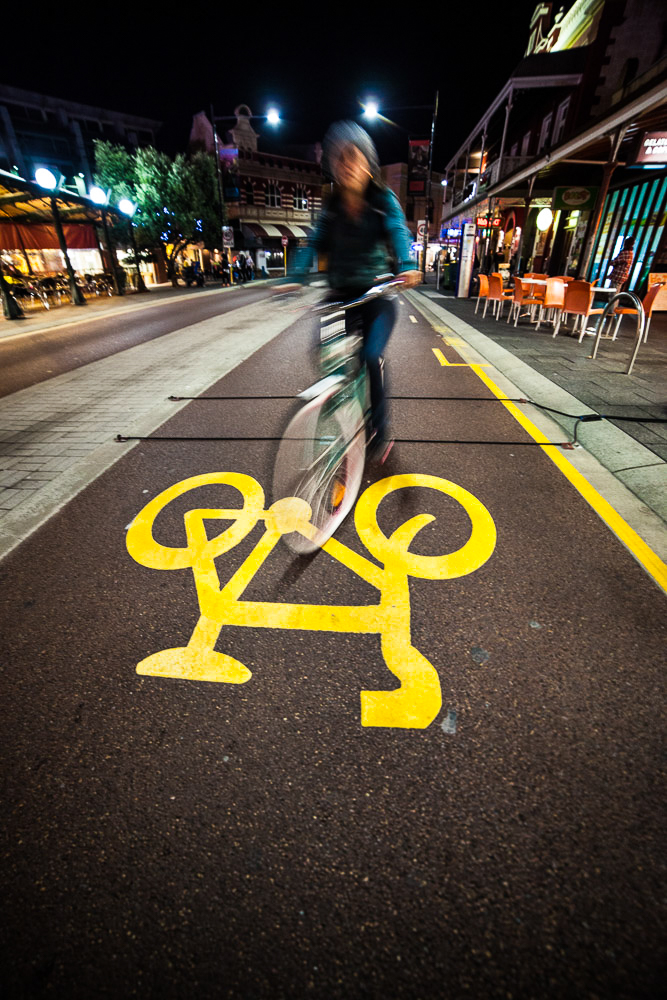 were using different types of bicycles or scooters at any point in time. ATLYST automatically uses the Shared Path Classification Scheme 02 to classify data collected with the RidePod counters and present the results in an interactive pie graph for each survey site.

Understanding traffic data – Easily identifying volumes on a map
ATLYST hasn’t only been beneficial to the City for monitoring cycling trends. The software has also been used to quickly visualise road traffic volumes on a map and identify streets where rat-running may be occurring.
Rat-running refers to the use of residential or local distributor roads to avoid congestion or lengthy trips on main roads.
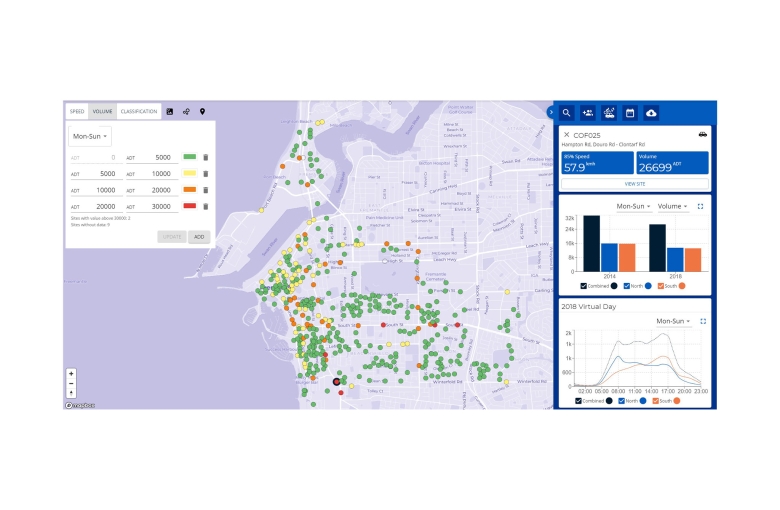
The City of Fremantle’s ATLYST map clearly shows that no rat-running is currently taking place and that all roads comply with Western Australia’s road hierarchy.
High volume district distributor roads are visible in red on the map with low volume local streets showing up as green, depending on average daily traffic (ADT) data from the most recent traffic survey.
Assessing traffic calming outcomes
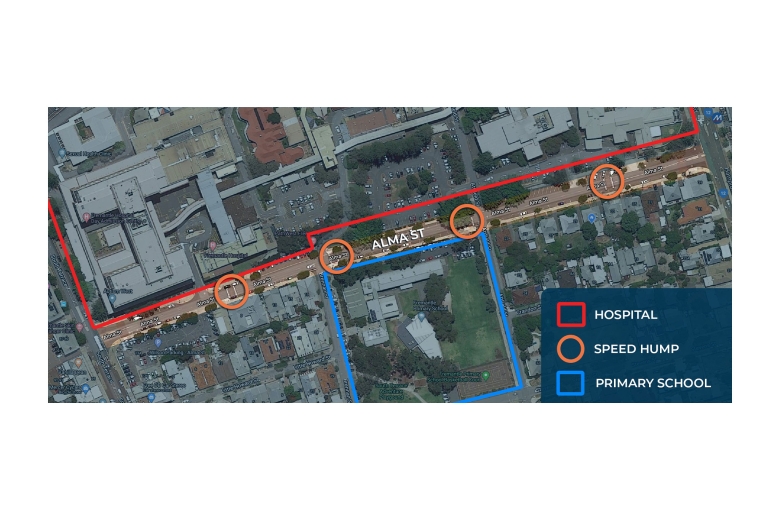
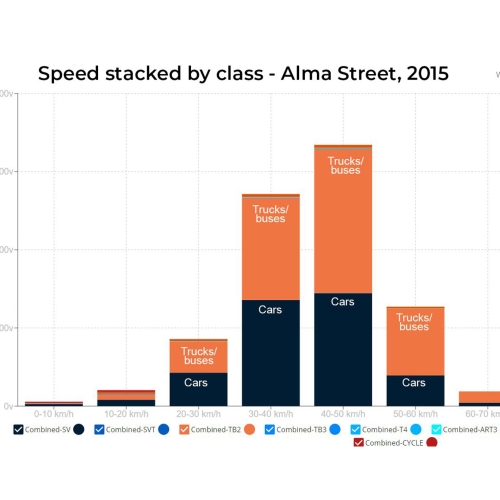
ATLYST has also allowed the City of Fremantle to very quickly assess the outcomes of a range of traffic calming measures. For example, a traffic survey completed in 2015 on Alma Street (running between a hospital, primary school and residential housing) showed vehicles were travelling at 60.7km/h (85th percentile speed).
The type of vehicles that most travelled above the speed limit on Alma street were class TB2 (trucks or buses with two axles) followed by SV (cars without trailers).
Due to high pedestrian and cycling activity along the street, the City installed four-speed humps with the aim of bringing the 85th percentile speed down significantly.
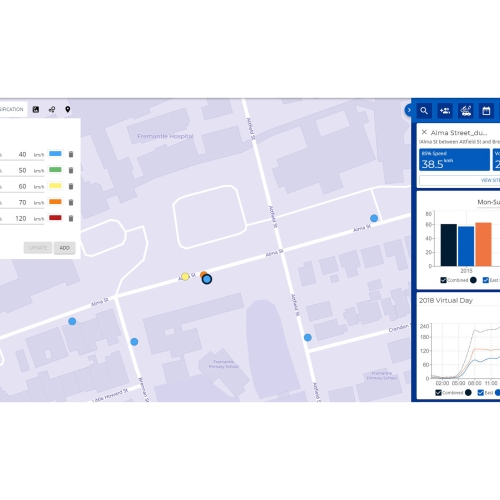
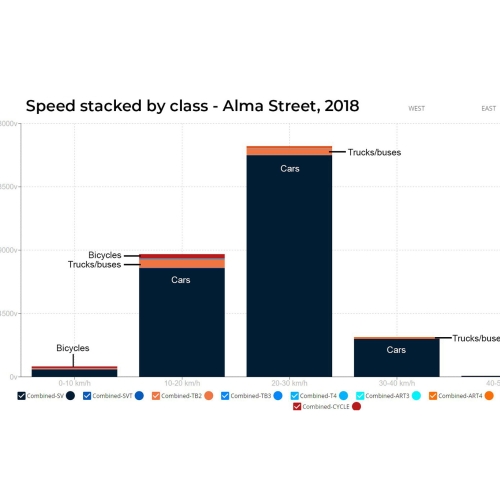
Viewing the results of the survey carried out after the humps were installed in ATLYST (see above), it’s clear to see the 85th percentile speed did indeed drop to 38.5km/h at the exact same survey site.
The percentage of TB2 vehicles dropped dramatically from 53% to 4% and, consequently, bicycle traffic increased from 0.4% to 1.6%. Volumes also reduced slightly from over 3,000 ADT to 2,800 ADT.
Overall, the cost-effective solution of installing four speed humps allowed for a safer and more pleasant environment for pedestrians and cyclists arriving or leaving the local primary school and hospital.
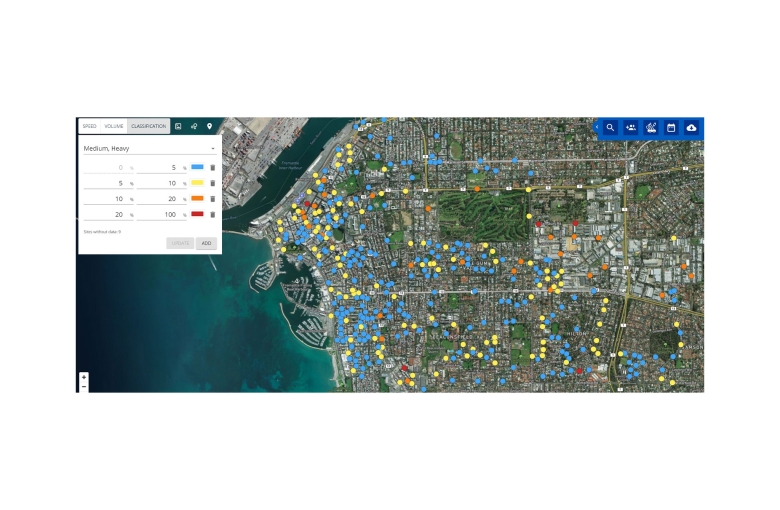
Pinpointing areas of heavy vehicle use
Understanding which roads are frequently used by medium or heavy vehicles helps the City plan for road resurfacing or maintenance requirements.
This information is cleary visible in ATLYST by using the classification layer.
Percentages of certain class types and their relating colours can be customised to clearly and quickly see roads that sustain heavy vehicle movements or areas with higher percentages of vulnerable road users (motorcyclists and cyclists).
As expected, Fremantle’s freight routes, industrial areas and bus routes appear in orange or red on the map above – representing that over 10% of all vehicles on these roads are either medium or heavy.
A simpler future for traffic management
Overall, ATLYST has allowed the City of Fremantle to more holistically understand traffic data and driver behaviour across their road and cycling networks.
This in turn ensures that road maintenance, infrastructure upgrades and traffic calming measures are informed with updated, easy-to-read data across the board.
ATLYST is being rolled out across dozens of local governments and National/State parks around Australia and New Zealand. For a free trial of the online software contact MetroCount.
Got a great MetroCount story? Share it with us and let the world know the great work you're doing in your community.