Although the RoadPod VT can record cyclists travelling in mixed traffic or on a bike lane/shared path, it won’t provide the accuracy required when specifically gathering active transport data.
Miscounting bikes
The RoadPod VT was designed for gathering data on multi-axle road vehicles. When correctly installed in this setting, accuracy is extremely high (99.7% when tested against video footage).
Using the RoadPod VT to count lighter vehicles such as bicycles, however, is a different story. This can be problematic for a few reasons:
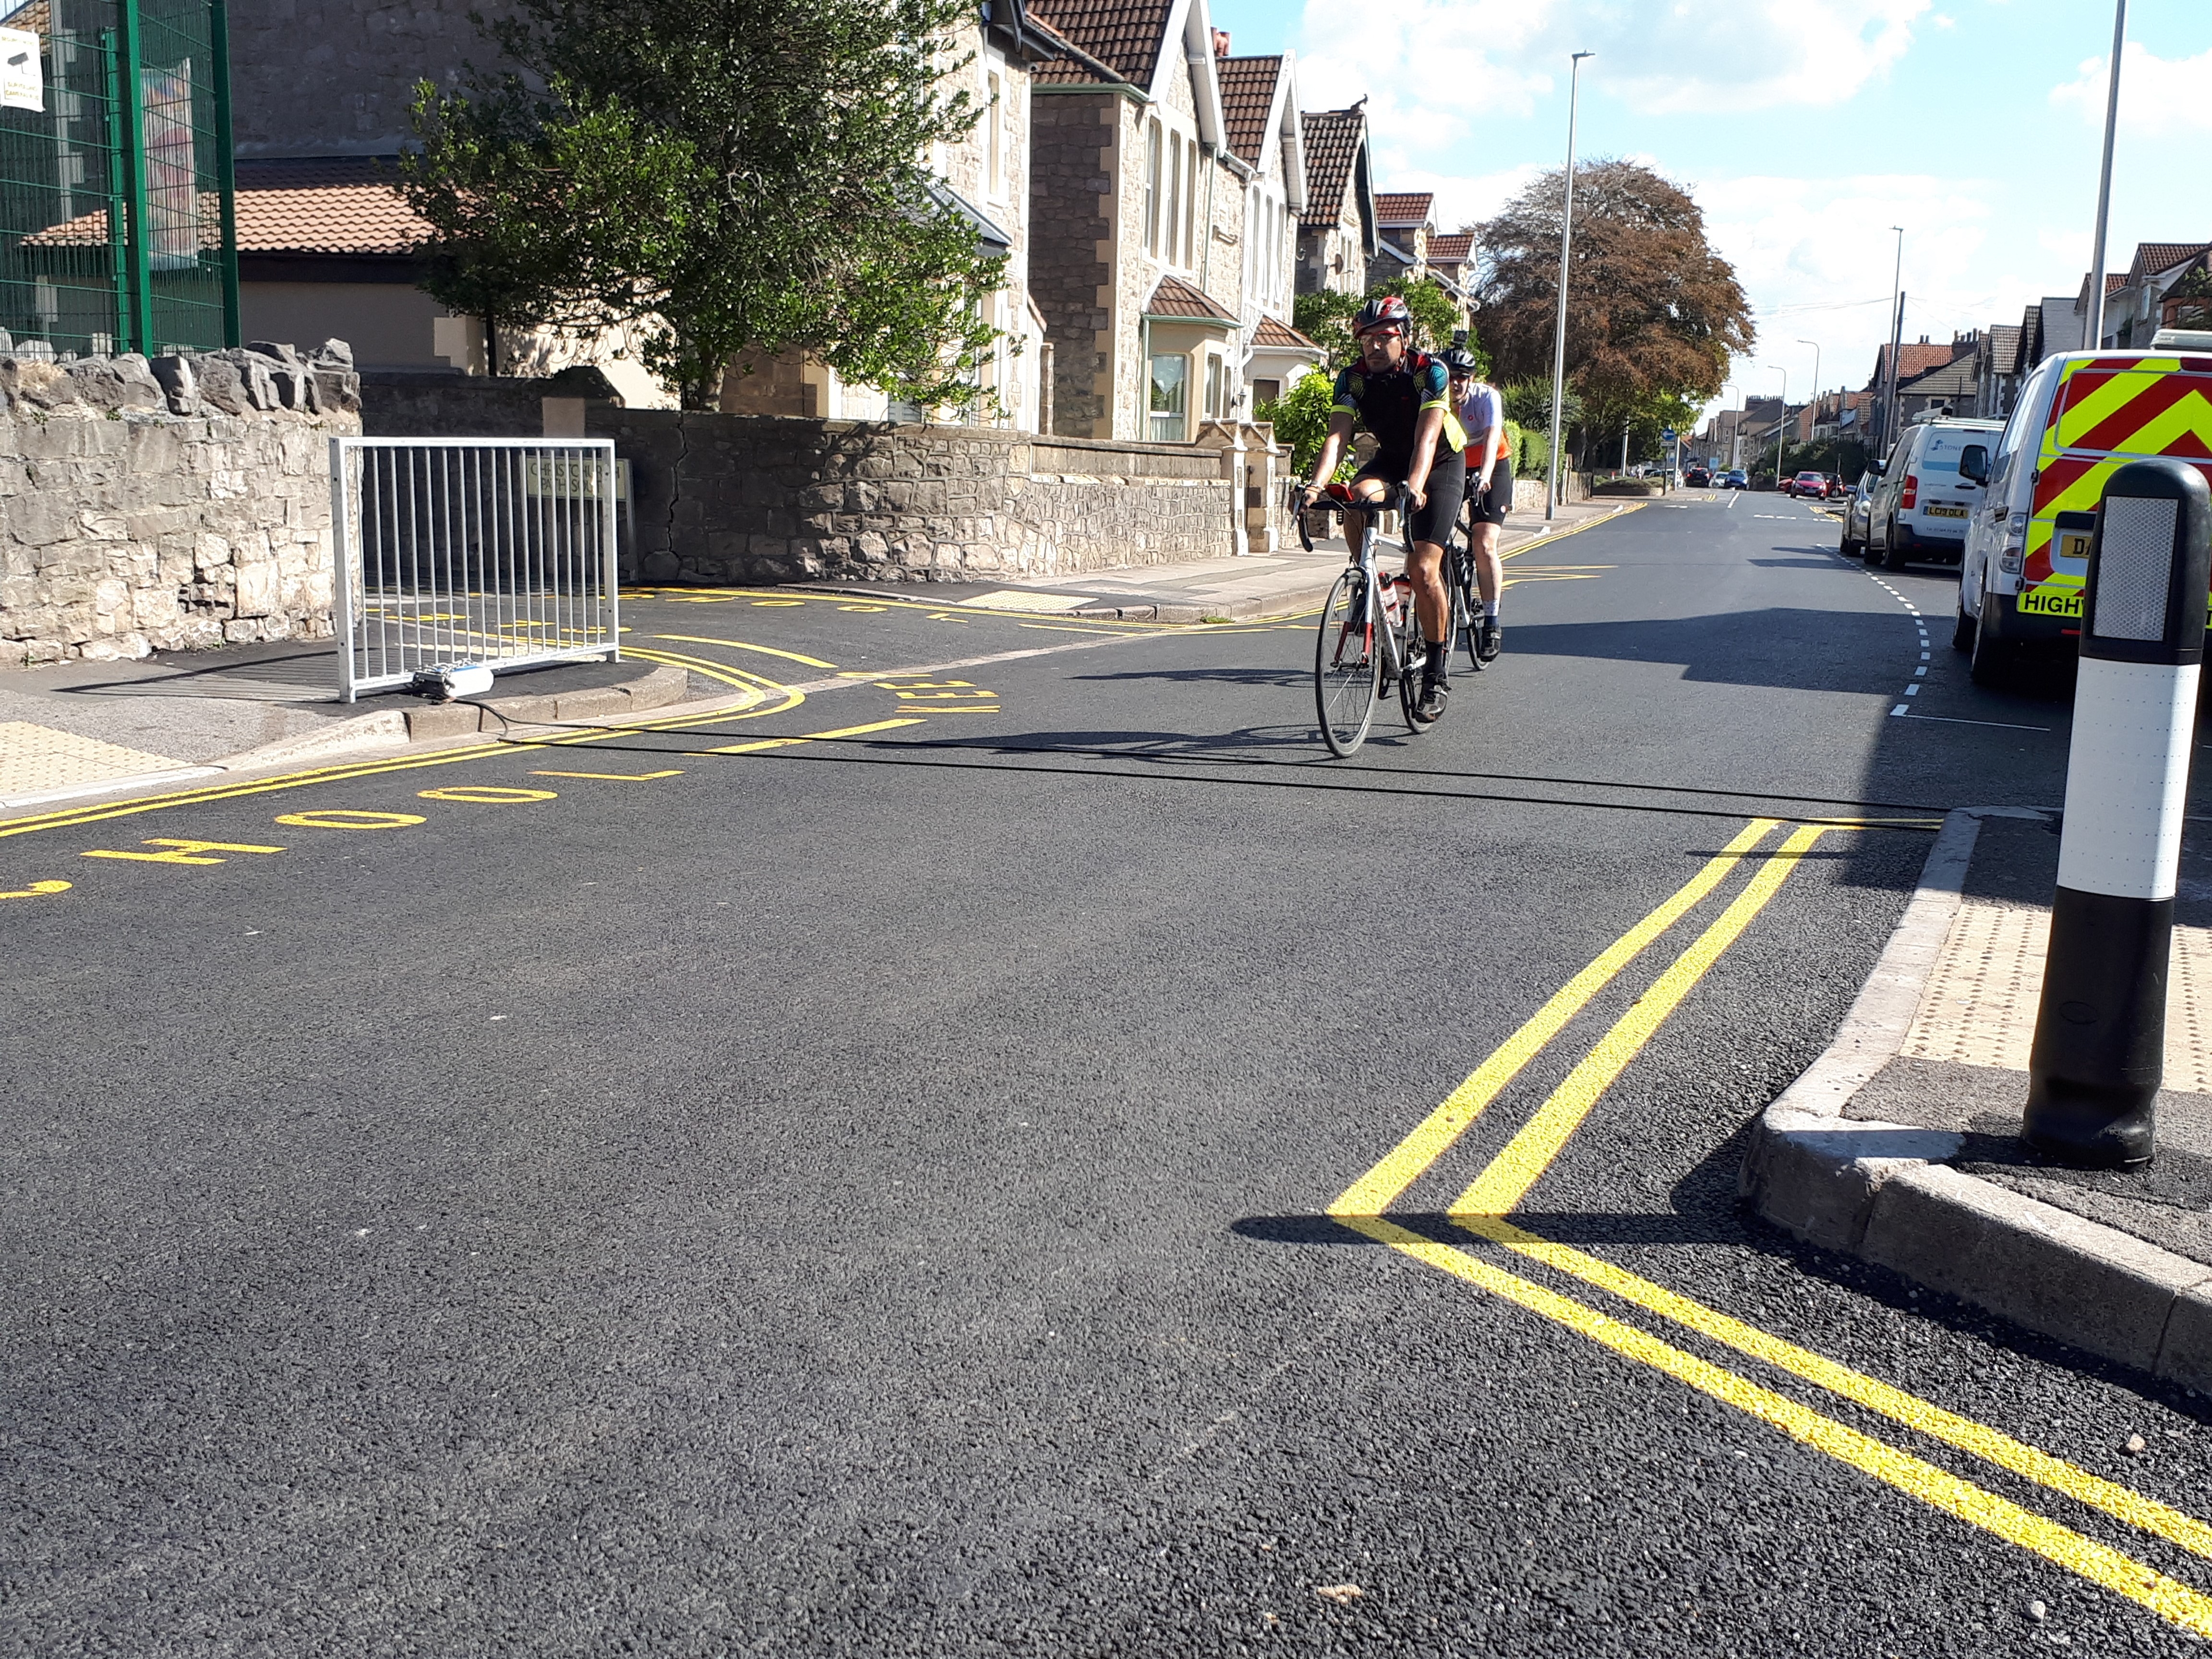
- Bikes might not be detected because they aren’t heavy enough, especially on the front axle, to trigger an air pulse that will travel the length of the pneumatic tube sensors and reach the traffic counter.
- A group of bicycles travelling in a tight group may be miscounted or misclassified as a multi-axle vehicle (eg. 2 bikes riding together over sensors may be classified as a 4-axle truck or bus).
- If a bicycle travels over the tubes at the exact same time as another vehicle, it may be masked and not counted.
All points above potentially mean bicycles are consistently undercounted when using the RoadPod VT.
Less room for error when surveying cyclists compared to road traffic
Accuracy is important when it comes to cycling surveys in particular for two main reasons:
1. A much smaller sample size
Only extremely rarely will a cycleway match a road in terms of volume of use. This means bike surveys are generally based on much smaller sample sizes, which are likely to have a higher margin of error.
According to Qualtrics, “if your sample is too small, you may include a disproportionate number of individuals which are outliers and anomalies. These skew the results, and you don’t get a fair picture of the whole population.”
2. Margin of error & subtle cycling trends
When looking at past examples of cities committed to increasing cycling, annual growth ranges from 5-9%.
- London’s largest yearly increase in cycling since records began was 5% in 2018.
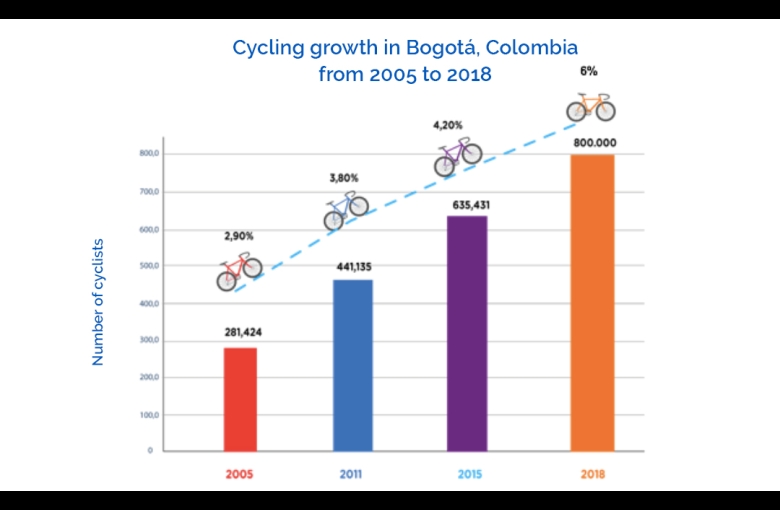
- After heavily investing in cycling infrastructure, Bogotá’s bike growth increased by around 26% over 3 years (averaging out to 8.7% a year).
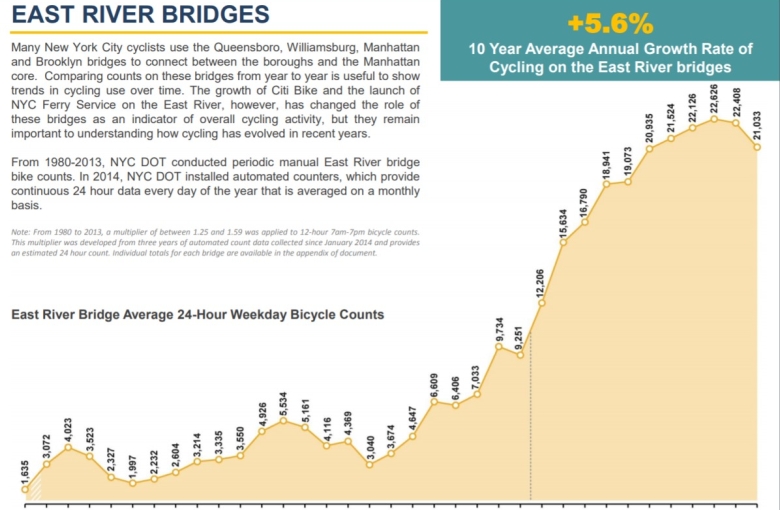
- New York City’s 10-year average annual cycling growth was 5.6% on the East River bridges.
Unless vast upgrades are made to bike infrastructure, most cities experience slower cycling growth than this. Why is this an issue related to gathering data?
If the accuracy of the counting system used has a larger deviation from 100% than the percentage of annual cycling growth, then this can potentially erase any visible growth in the data.
For example, if the accuracy is +/-10% and true annual cycling growth is 3% then the data recorded will show results ranging from -7% growth to +13% growth. In other words, cycling was up 3%, yet the survey could potentially show that cycling had, in fact, decreased.
Traffic counters specifically designed to monitor bikes
A need for extreme accuracy when surveying cycleways prompted MetroCount to design a range of solutions dedicated to surveying bicycle flows back in 2008.
Permanent cycleway surveys
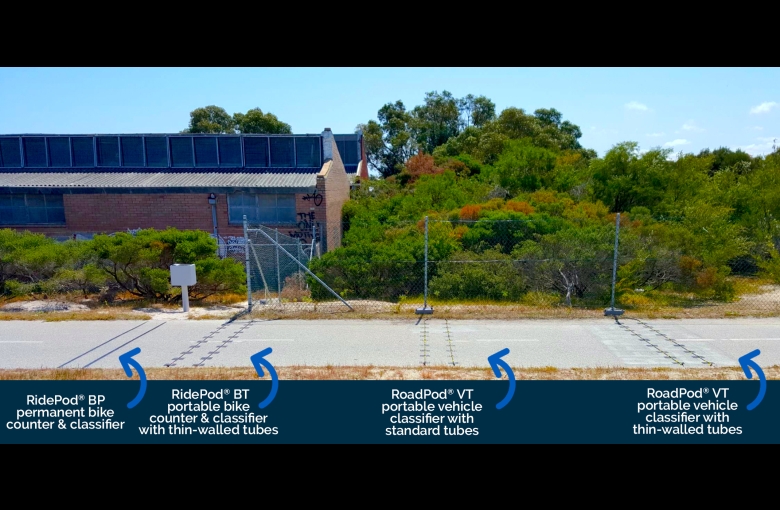
The RidePod® BP uses permanently embedded piezoelectric sensors for extremely accurate, long-term data collection on bike lanes and shared paths. It has been independently verified with an accuracy of 99%.
Short-term cycleway surveys
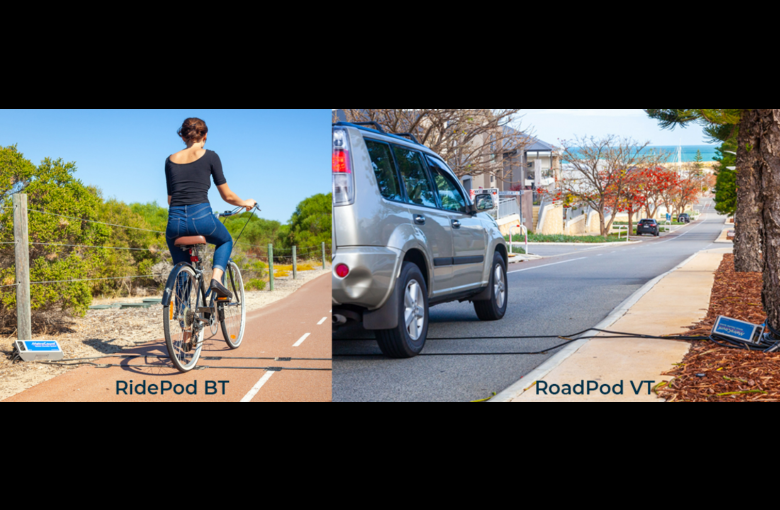
The portable RidePod® BT uses pneumatic tube sensors similar to those of the RoadPod VT. This can be confusing as all MetroCount protective cases look almost identical. The RidePod BT, however, uses specifically designed thin-walled tubes in combination with highly sensitive air switches to more accurately record lighter bicycles and scooters.
The RidePod BT has also been engineered to differentiate individual bicycles and e-scooters from all other traffic, even when travelling together in tight groups. In addition, its complex bike algorithm ensures it records double-axle vehicles only, guaranteeing that groups of bikes are not missed or misclassified as larger vehicles.
Testing the difference
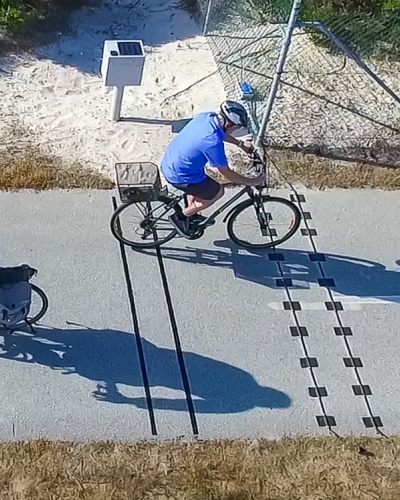
A 2015 test clearly shows the difference in accuracy levels of the RidePod BT vs RoadPod VT when compared to statistics from the permanently installed RidePod BP bike counter.
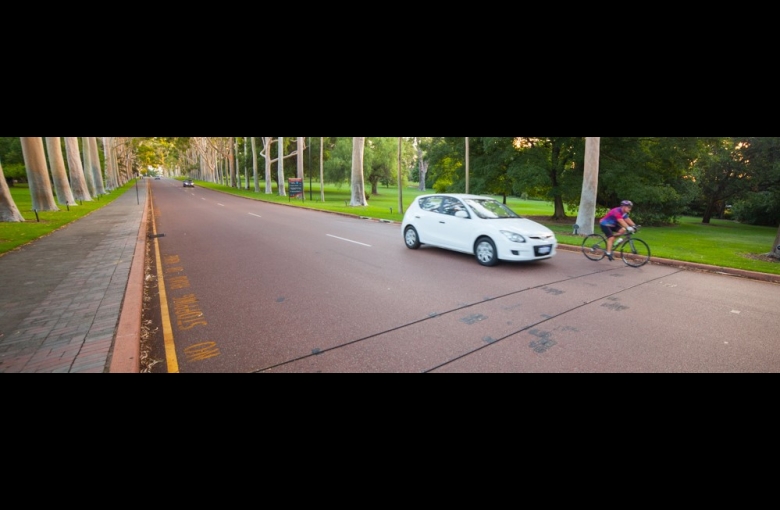
The surveys were installed side-by-side for 250 days on a sealed shared path in Fremantle, Western Australia.
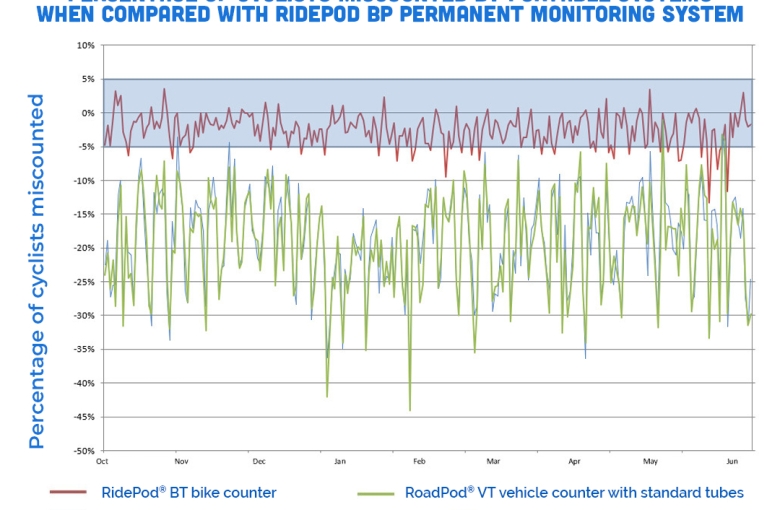
RidePod BT vs RoadPod VT: The results
- On average, the RoadPod VT recorded -20% fewer cyclists than the RidePod BP. This means roughly 1 in every 5 cyclists was not counted.
- There was minimal difference between results of the RoadPod VT when using traditional or thin-walled pneumatic tube.
- Daily differences varied between -5% and -40% fewer riders than the RidePod BP.
- The RidePod BT results were, on average, within +/- 2.5% accuracy of the RidePod BP, with a tendency to slightly undercount rather than overcount.
- Results from the RidePod BT were much more stable during the course of the entire survey. This stability is paramount for multiple surveys that will be compared over time.
- The RoadPod VT results were only within 5% of the RidePod BT results for 7 days out of 250.
- Overall there was an average difference of 17.7% in volume accuracy with the RidePod BT far outperforming the RoadPod VT.
That 17.7% is worrying when you consider the earlier examples of annual cycling growth.
The difference between using a RidePod BT and a RoadPod VT for surveying cycleways could mean the difference between recording near-perfect annual growth/decline or losing these trends entirely in the margin of error – making the entire survey obsolete.
We therefore strongly recommend using the RidePod BT to ensure an accurate reflection of real cycling volumes.
Got a great MetroCount story? Share it with us and let the world know the great work you're doing in your community.