What Is the 85th Percentile Speed?
The 85th percentile speed is one of the most widely used measures in traffic engineering. It helps transport professionals understand how drivers behave on a road, assess whether operating speeds are appropriate, and helps to make informed road-safety decisions.
Put simply, it reflects a speed near the upper end of those selected by drivers under free-flow conditions.
The 85th percentile speed definition is the speed at or below which 85% of observed vehicles are travelling under free-flow conditions. The remaining 15% of vehicles are travelling faster.
For example, if a traffic survey finds an 85th percentile speed of 62 km/h, it means 85% of the recorded vehicles were travelling at 62 km/h or less.
For most practical purposes, the 85th percentile can be treated as one standard deviation above the mean, provided the data is approximately normally distributed. However, if the data is unevenly distributed, this may not be the case.
Why Use the 85th Percentile?
The 85th percentile provides an objective measure of vehicle speed based on real-world driving behaviour. By recording how drivers naturally respond to the road environment, it gives traffic professionals a fact-based foundation for decision-making.
Most drivers choose their speed according to how they perceive road conditions. Factors such as lane width, visibility, surrounding development, intersections, curves and traffic activity can all influence how fast someone feels comfortable travelling. The 85th percentile captures the higher end of these typical speeds while preventing a small number of exceptionally fast vehicles from distorting the result.
Some studies have found that vehicles travelling at similar speeds are generally less likely to be involved in crashes than vehicles travelling at very different speeds. For this reason, the 85th percentile may be considered when reviewing speed limits, with the aim of reducing the gap between faster and slower vehicles and supporting safer, more consistent traffic flow. However, research also shows that the relationship between speed and crashes is complex. The 85th percentile should therefore be considered alongside road design, crash history and local traffic conditions.
Because it provides a consistent measure, the 85th percentile can also be used to compare speeds between different roads, locations or survey periods. This helps traffic professionals identify where speeds are higher, track changes in driver behaviour over time and evaluate the impact of road-safety treatments.
For example, speeds can be measured before and after installing speed humps, raised crossings, lane narrowing or other traffic-calming measures to assess whether the treatment has reduced vehicle speeds.
The 85th percentile is also relatively straightforward to calculate. Historically, this made it a useful tool for traffic engineers, as it could be worked out by hand to provide a practical measure of typical driving speeds before computers became widely available.
The 85th percentile is found near the upper end of the observed speed distribution.
How to Calculate the 85th Percentile Speed
The 85th percentile speed calculation can be worked out using a list of speeds or a graph. Both methods find the speed that 85% of vehicles are travelling at or below.
The basic process is:
- Record the speed of each vehicle using a traffic counter.
- Arrange the observations from lowest to highest.
- Calculate the 85th-percentile position.
- Identify or interpolate the speed at that position.

Method 1: Using a List of Speeds
First, collect vehicle speed data and arrange the speeds from slowest to fastest.
Then multiply the total number of vehicles by 0.85. This simple 85th percentile speed formula tells you which vehicle in the list represents the 85th percentile.
For example, if you record the speeds of 200 vehicles:
200 × 0.85 = 170
Using this method, the speed of the 170th vehicle in the list is the 85th percentile speed. If the answer is not a whole number, round up or use a value between the two closest speeds, depending on the calculation method.
Note 1: To calculate an accurate 85th percentile speed, you need enough vehicles recorded. Software like MTE requires at least 200 vehicles for each time period, whether that's 15 minutes, an hour or a day.
Note 2: The 85th percentile speed must be calculated separately for each time period. For example, you cannot calculate a daily 85th percentile by averaging the 24 hourly results. The speed of every vehicle must be recorded that day to calculate the daily 85th percentile.
Method 2: Using a Graph
You can also group the speeds into ranges, such as 40–44 km/h and 45–49 km/h.
Work out how many vehicles fall into each range, then calculate the running total as a percentage.
Plot this on a graph, with vehicle speed along the bottom and cumulative percentage up the side.
Find 85% on the vertical axis, move across to the curve, then move down to the speed axis. The speed you reach is the 85th percentile speed.
Collecting Reliable Speed Data for the 85th Percentile
The calculation is only as dependable as the source data. A poorly selected survey location or a short, unrepresentative monitoring period can produce a technically correct result that does not reflect normal road use.
Survey Planning for Reliable Data Should Consider:
- The purpose of the study
- Road and lane configuration
- Survey duration
- Direction of travel
- Time-of-day and day-of-week effects
- Vehicle classification
- Seasonal variation
- Weather and temporary disruptions
- Local survey standards
Best Practices for 85th Percentile Data Collection
Use free-flow conditions: Collect speed data during off-peak periods when drivers are not slowed by congestion, traffic signals or other vehicles. This gives a better picture of the speed drivers would naturally choose.
Apply a headway filter: A 4-second headway filter can be used to remove vehicles that are travelling too closely together. This helps separate free-flowing vehicles from those affected by congestion.
Collect enough data: Record speeds from at least 100 vehicles, or collect data over a full weekday using an automatic traffic counter. A larger sample gives a more reliable result.
Choose the right location: Place pneumatic tubes away from major intersections, stop signs and other features that may cause drivers to slow down or speed up. This helps ensure the data reflects normal driving behaviour.
Consider when the survey takes place: The 85th percentile can change between weekdays and weekends, peak and off-peak periods, school terms and holidays. Seasonal changes, special events and tourism can also influence vehicle speeds. Survey periods should therefore represent normal road conditions as closely as possible.
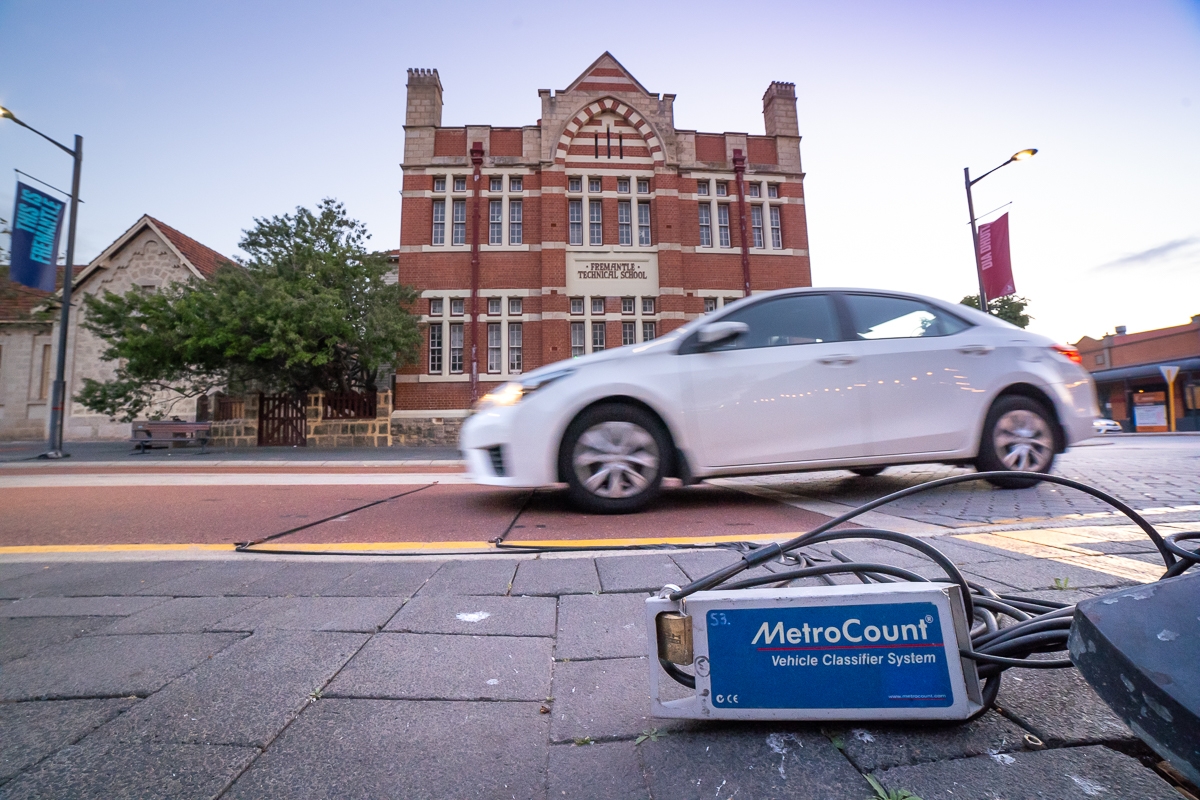
MetroCount’s portable RoadPod VT traffic counter records individual vehicle speeds along with traffic volume, vehicle class, direction, gaps and other traffic data. For long-term traffic monitoring, MetroCount also offers a wider range of traffic counters and classifiers.
Limitations of the 85th Percentile Rule
The 85th percentile is a useful measure, but it is not always enough on its own. This is especially important in busy urban areas, where roads are shared by drivers, pedestrians, cyclists and public transport users.
One concern is that relying too heavily on observed speeds can create a feedback loop. If drivers travel faster, the 85th percentile rises. If speed limits are then increased to match, this may encourage even higher speeds. In areas with more vulnerable road users, that can increase safety risks.
Road design also affects driver behaviour. Wide lanes, long sight distances and straight roads can encourage higher speeds, even when the surrounding area includes homes, shops or schools. This means the 85th percentile shows how drivers respond to the road, but not always what the safest speed should be.
Analysts should therefore review additional measures such as:
- Mean and median speeds
- Pace speed
- Maximum recorded speeds
- The percentage exceeding selected thresholds
- Speed variation
- Vehicle-class differences
- Hourly, directional and seasonal patterns
- Crash history
- Pedestrian and cyclist volumes
- Sight distance and intersection conditions
- Surrounding land use
The 85th percentile is still useful for understanding how traffic is moving, but it is generally more informative when combined with other safety and road-context data rather than used as the only basis for setting speed limits.
A Broader Approach to Speed Management
Because the 85th percentile rule has limits, many transport agencies now consider road design, local conditions and the safety of pedestrians, cyclists and other road users when setting speed limits.
Four key approaches can help improve speed management:
Set Speed Limits to Match the Road Environment:
Speed limits should reflect the conditions of each road. Factors such as nearby schools, pedestrian activity, bike lanes, intersections and surrounding development can all affect what speed is safe. This creates speed limits that are suited to the location, rather than using the same method for every road.
Design Roads to Encourage Safer Speeds:
Road design can influence how fast people drive. Features such as narrower lanes, speed humps, raised crossings and roundabouts can naturally slow traffic and make safer speeds feel more appropriate.
Focus on Reducing Serious Injuries and Deaths:
Approaches such as Vision Zero aim to prevent road deaths and serious injuries by recognising that the human body can only withstand limited impact forces. In busy urban areas, this may support lower speed limits, often around 30–50 km/h depending on the road and surrounding activity.
Use Enforcement to Support Safer Speeds:
Speed cameras and other automated enforcement tools can help encourage drivers to follow posted speed limits. These measures are most effective when they support well-designed roads and clearly communicated speed limits.
Community input is also important. Local residents and road users can help identify areas where speeding, pedestrian activity or road design may create safety concerns. Including this feedback can help transport agencies make speed-management decisions that better reflect local conditions.
Using the 85th Percentile Responsibly
The 85th percentile is a useful measure of vehicle speeds under free-flow conditions, but it should not determine speed limits on its own. Traffic engineers should consider it alongside crash history, road design, surrounding land use and the needs of all road users.
Got a great MetroCount story? Share it with us and let the world know the great work you're doing in your community.