Murray River Council (MRC), a local government entity responsible for 11,865 square kilometres of farmland and rural towns on the border of Victoria and New South Wales, is one of them.
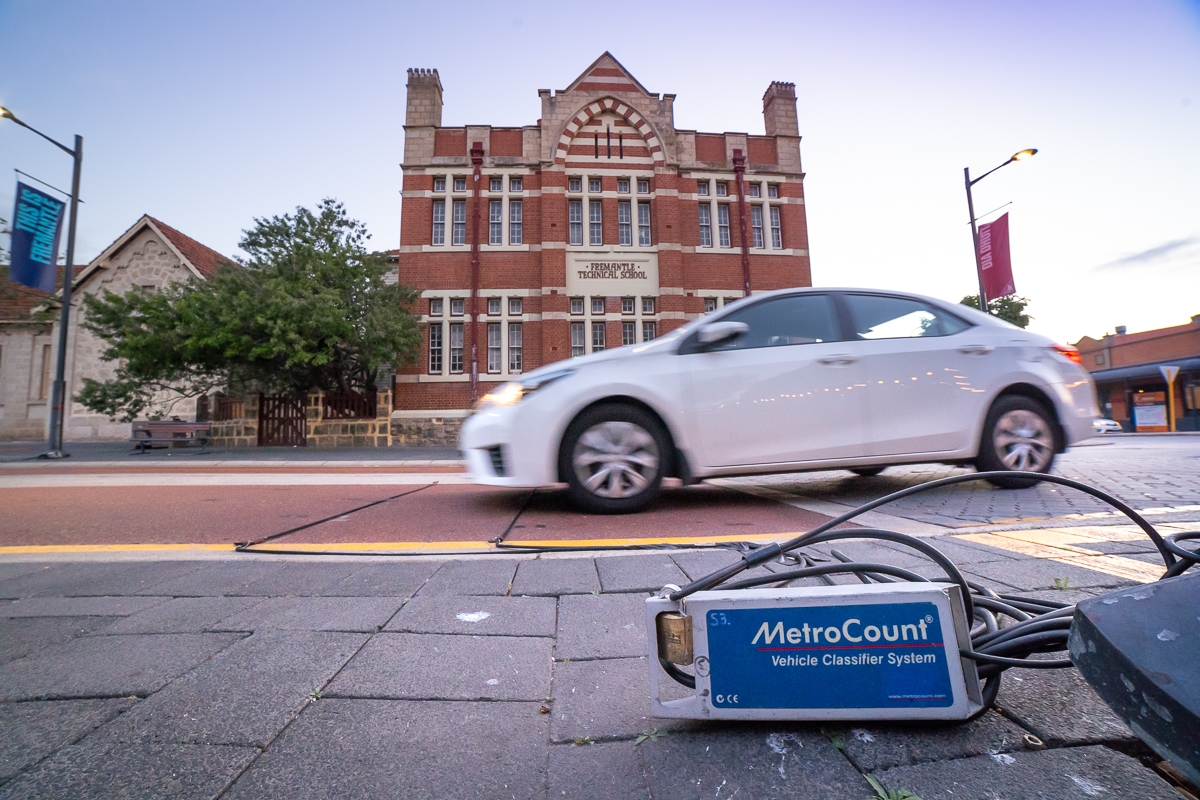
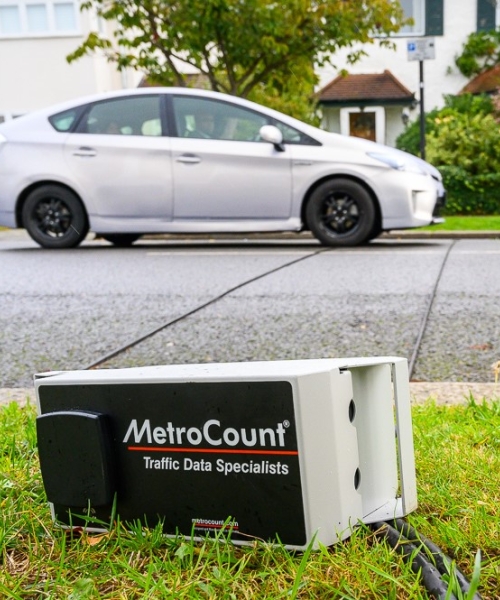
Since 1998 MRC has been monitoring traffic using MetroCount tube counters to proactively plan for road maintenance and future proof infrastructure to accommodate the high percentage of heavy goods vehicles using their roads.
In 2020 they used their existing traffic counters with new Remote Access Links to monitor four state border crossings 24/7 as part of an effort to minimise the spread of COVID-19.
We had a chat with Jyle Balsillie from Murray River Council’s Civil Construction Department to find out more.
What are the most useful traffic statistics you collect with your monitoring systems as a regional council?
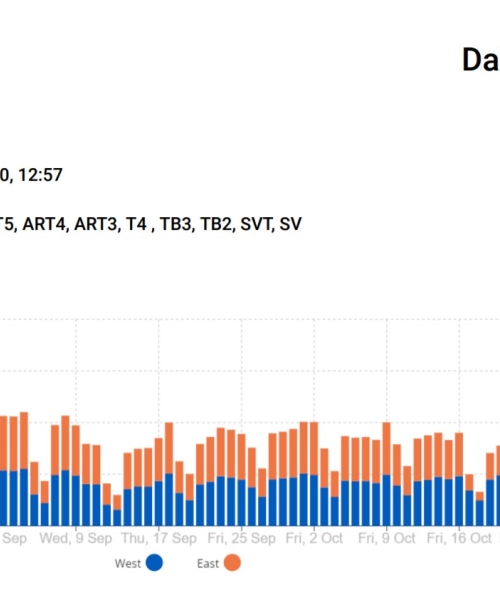
“We mostly use our traffic counters to collect vehicle volumes, speed and class information. During analysis, we usually focus on vehicle volumes, number of axles, and percentages of heavy vehicles.
Once we have these figures, our traffic engineers use them to determine what materials and how much cover and stabilisation is needed for road resurfacing and maintenance.”
What else do you use the information collected with your traffic counters for?
“Apart from informing road reconstruction we use traffic data to apply for state and federal funding grants to be able to pay for infrastructure improvements. We also use the traffic counters to investigate complaints from residents regarding heavy vehicles using roads they shouldn’t or of locations prone to speeding.
The information collected then informs traffic calming measures, like installing speed humps, re-routing heavy traffic to other more suitable roads, or reducing the posted speed limit.
This year, we also set up four traffic counters to help monitor the influx of vehicles coming across the state border with Victoria during their second wave of COVID infections."
Being a border council, how was MRC affected by COVID, and how did your traffic counters help?
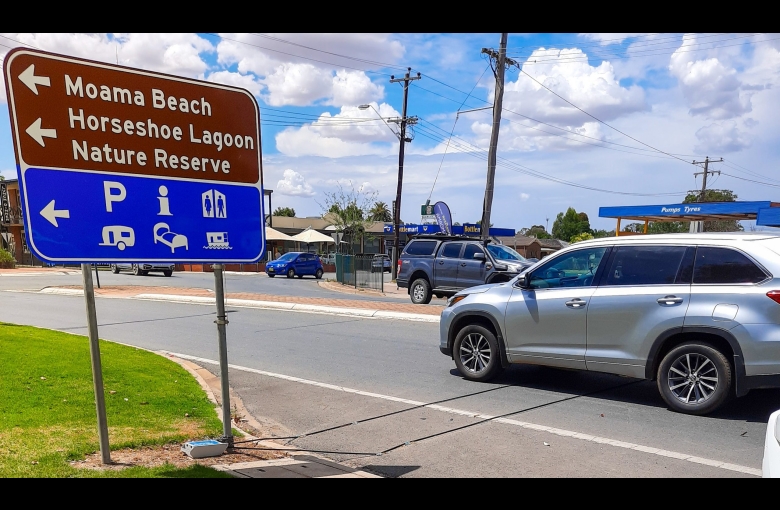
“We are responsible for a large landmass right on the border with Victoria, separated by the Murray River. In July this year, the New South Wales state government decided to close all borders with Victoria for non-essential travel as coronavirus numbers grew rapidly in Melbourne and other Victorian towns.
This meant that we were required to put checkpoints in place at the four river crossings at Moama Bridge, Barham Bridge, Tooleybuc Bridge and Swan Hill Bridge.
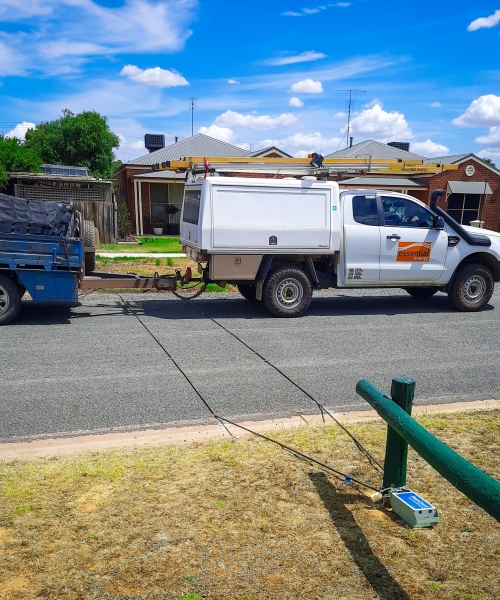
We decided to purchase four new Remote Access Links that could be connected to our existing MetroCount traffic counters and used these to help us monitor the traffic 24/7 at all four border crossings.
We decided to purchase four new Remote Access Links that could be connected to our existing MetroCount traffic counters and used these to help us monitor the traffic 24/7 at all four border crossings.
What is the benefit of being able to connect to your counters remotely?
“The border traffic counters were in place permanently for five months from July through to November and helped us immensely because they gave us data every single day with very little effort.
Now that the border has reopened, we plan to set up the counters with the Remote Access Links on the four busiest roads to better understand long-term traffic behaviour.
Having the Remote Access Links saves us a lot of time because our council is so big and traffic monitoring sites can be so spread out that reaching them takes hours.
Now instead of having to drive 2 hours to download data or check on a traffic survey, we can just connect to the counter from the office. This means we can check on surveys every day to ensure there are no tube breakages or issues and reduce the likelihood of data gaps in the resulting information.”
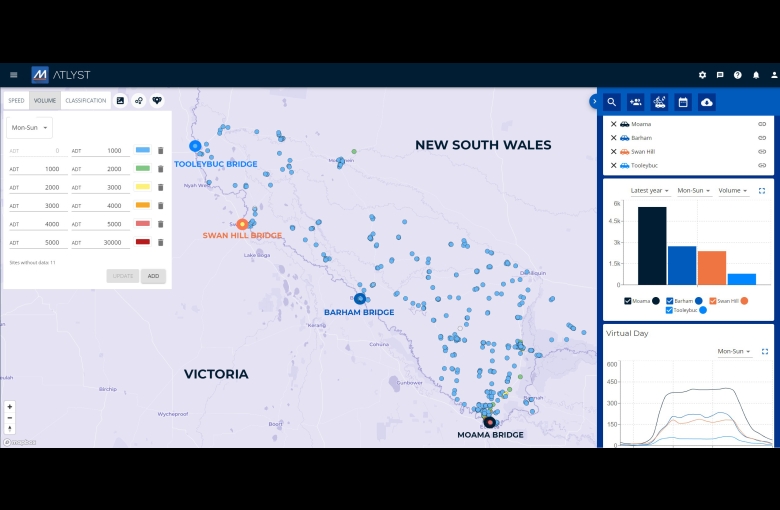
MRC recently started using MetroCount’s online analytics dashboard, ATLYST. What have been your first impressions?
“We’ve been using ATLYST for roughly 6 months and are so far very impressed. It makes access to data much easier between different people and departments. ATLYST saves me a lot of time having to find specific traffic data files from certain years and generating reports for sharing.”
How has ATLYST changed the way you survey and analyse traffic data?
“Instead of having to create specific reports for various requirements, when prompted for traffic count information, I can now just direct others to view the automated information displayed on ATLYST.
Viewing the data map makes it a lot easier to plan where traffic counts should be done and to identify areas that need attention.
We have also changed the way we set up counters to include the exact GPS coordinates so that when data is uploaded to ATLYST it is automatically placed at the right position on the map. This also helps us with survey consistency and comparing data year-on-year.”
What are your favourite features of ATLYST and why?

“I really like the volume, speed and class layers and how you can customise the colours to define different levels/types of traffic. It makes it really easy to pinpoint which areas have the most traffic and which areas have the most heavy vehicles and be able to prioritise rehabilitation works.”
Thanks Jyle, for your insight into how the Murray River Council makes the most of their traffic monitoring equipment and software. For more information on any of the products or services mentioned in this case study, contact MetroCount.
Got a great MetroCount story? Share it with us and let the world know the great work you're doing in your community.